Subsaharan African vs Zimbabwean 11th Grade
COMPARE
Subsaharan African
Zimbabwean
11th Grade
11th Grade Comparison
Sub-Saharan Africans
Zimbabweans
91.7%
11TH GRADE
2.9/ 100
METRIC RATING
235th/ 347
METRIC RANK
93.9%
11TH GRADE
99.8/ 100
METRIC RATING
68th/ 347
METRIC RANK
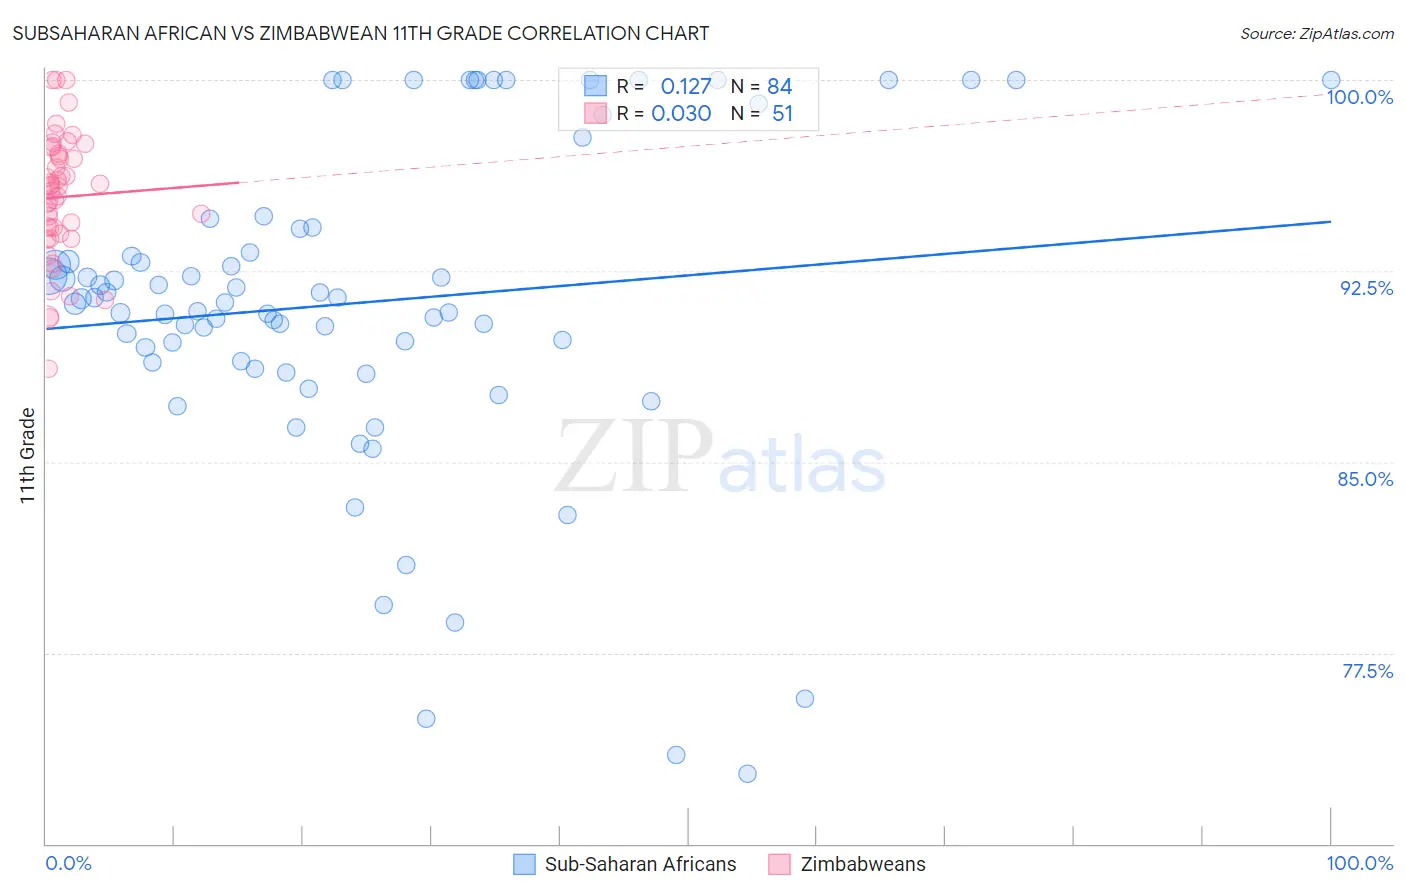
Subsaharan African vs Zimbabwean 11th Grade Correlation Chart
The statistical analysis conducted on geographies consisting of 508,219,008 people shows a poor positive correlation between the proportion of Sub-Saharan Africans and percentage of population with at least 11th grade education in the United States with a correlation coefficient (R) of 0.127 and weighted average of 91.7%. Similarly, the statistical analysis conducted on geographies consisting of 69,203,423 people shows no correlation between the proportion of Zimbabweans and percentage of population with at least 11th grade education in the United States with a correlation coefficient (R) of 0.030 and weighted average of 93.9%, a difference of 2.4%.
11th Grade Correlation Summary
| Measurement | Subsaharan African | Zimbabwean |
| Minimum | 72.7% | 88.7% |
| Maximum | 100.0% | 100.0% |
| Range | 27.3% | 11.3% |
| Mean | 91.3% | 95.4% |
| Median | 91.3% | 95.8% |
| Interquartile 25% (IQ1) | 88.9% | 94.0% |
| Interquartile 75% (IQ3) | 94.2% | 97.1% |
| Interquartile Range (IQR) | 5.3% | 3.1% |
| Standard Deviation (Sample) | 6.3% | 2.5% |
| Standard Deviation (Population) | 6.3% | 2.4% |
Similar Demographics by 11th Grade
Demographics Similar to Sub-Saharan Africans by 11th Grade
In terms of 11th grade, the demographic groups most similar to Sub-Saharan Africans are Armenian (91.7%, a difference of 0.0%), Colombian (91.7%, a difference of 0.0%), Immigrants from Bolivia (91.7%, a difference of 0.0%), Cheyenne (91.8%, a difference of 0.030%), and Comanche (91.7%, a difference of 0.030%).
| Demographics | Rating | Rank | 11th Grade |
| Immigrants | Panama | 4.3 /100 | #228 | Tragic 91.8% |
| Nigerians | 4.3 /100 | #229 | Tragic 91.8% |
| Immigrants | Afghanistan | 3.9 /100 | #230 | Tragic 91.8% |
| Choctaw | 3.7 /100 | #231 | Tragic 91.8% |
| Uruguayans | 3.5 /100 | #232 | Tragic 91.8% |
| Cheyenne | 3.3 /100 | #233 | Tragic 91.8% |
| Armenians | 2.9 /100 | #234 | Tragic 91.7% |
| Sub-Saharan Africans | 2.9 /100 | #235 | Tragic 91.7% |
| Colombians | 2.8 /100 | #236 | Tragic 91.7% |
| Immigrants | Bolivia | 2.8 /100 | #237 | Tragic 91.7% |
| Comanche | 2.6 /100 | #238 | Tragic 91.7% |
| Hopi | 2.5 /100 | #239 | Tragic 91.7% |
| South Americans | 2.0 /100 | #240 | Tragic 91.6% |
| Bahamians | 1.8 /100 | #241 | Tragic 91.6% |
| Immigrants | Middle Africa | 1.6 /100 | #242 | Tragic 91.6% |
Demographics Similar to Zimbabweans by 11th Grade
In terms of 11th grade, the demographic groups most similar to Zimbabweans are Scotch-Irish (93.9%, a difference of 0.0%), Alaskan Athabascan (93.9%, a difference of 0.020%), Immigrants from Netherlands (93.9%, a difference of 0.020%), Immigrants from Sweden (93.9%, a difference of 0.040%), and Native Hawaiian (93.9%, a difference of 0.040%).
| Demographics | Rating | Rank | 11th Grade |
| Immigrants | Belgium | 99.8 /100 | #61 | Exceptional 94.0% |
| Austrians | 99.8 /100 | #62 | Exceptional 94.0% |
| Ukrainians | 99.8 /100 | #63 | Exceptional 94.0% |
| Immigrants | Sweden | 99.8 /100 | #64 | Exceptional 93.9% |
| Native Hawaiians | 99.8 /100 | #65 | Exceptional 93.9% |
| Alaskan Athabascans | 99.8 /100 | #66 | Exceptional 93.9% |
| Immigrants | Netherlands | 99.8 /100 | #67 | Exceptional 93.9% |
| Zimbabweans | 99.8 /100 | #68 | Exceptional 93.9% |
| Scotch-Irish | 99.8 /100 | #69 | Exceptional 93.9% |
| Immigrants | England | 99.7 /100 | #70 | Exceptional 93.8% |
| Immigrants | South Africa | 99.7 /100 | #71 | Exceptional 93.8% |
| Immigrants | Japan | 99.7 /100 | #72 | Exceptional 93.8% |
| Romanians | 99.6 /100 | #73 | Exceptional 93.8% |
| Immigrants | Czechoslovakia | 99.6 /100 | #74 | Exceptional 93.8% |
| Immigrants | Latvia | 99.6 /100 | #75 | Exceptional 93.8% |