Immigrants from Cameroon vs Czech Disability Age 65 to 74

COMPARE

Immigrants from Cameroon
Race
Ancestry
AfghanAfricanAlaska NativeAlaskan AthabascanAlbanianAleutAlsatianAmericanApacheArabArapahoArgentineanArmenianAssyrian/Chaldean/SyriacAustralianAustrianBahamianBangladeshiBarbadianBasqueBelgianBelizeanBermudanBhutaneseBlackfeetBolivianBrazilianBritishBritish West IndianBulgarianBurmeseCajunCambodianCanadianCape VerdeanCarpatho RusynCelticCentral AmericanCentral American IndianCherokeeCheyenneChickasawChileanChineseChippewaChoctawColombianColvilleComancheCosta RicanCreeCreekCroatianCrowCubanCypriotCzechoslovakianDanishDelawareDominicanDutchDutch West IndianEastern EuropeanEcuadorianEgyptianEnglishEstonianEthiopianEuropeanFijianFilipinoFinnishFrenchFrench American IndianFrench CanadianGermanGerman RussianGhanaianGreekGuamanian/ChamorroGuatemalanGuyaneseHaitianHmongHonduranHopiHoumaHungarianIcelanderIndian (Asian)IndonesianInupiatIranianIraqiIrishIroquoisIsraeliItalianJamaicanJapaneseJordanianKenyanKiowaKoreanLaotianLatvianLebaneseLiberianLithuanianLumbeeLuxembourgerMacedonianMalaysianMalteseMarshalleseMenomineeMexicanMexican American IndianMongolianMoroccanNative HawaiianNavajoNepaleseNew ZealanderNicaraguanNigerianNorthern EuropeanNorwegianOkinawanOsageOttawaPaiutePakistaniPalestinianPanamanianParaguayanPennsylvania GermanPeruvianPimaPolishPortuguesePotawatomiPuebloPuerto RicanPuget Sound SalishRomanianRussianSalvadoranSamoanScandinavianScotch-IrishScottishSeminoleSenegaleseSerbianShoshoneSierra LeoneanSiouxSlavicSlovakSloveneSomaliSouth AfricanSouth AmericanSouth American IndianSoviet UnionSpaniardSpanishSpanish AmericanSpanish American IndianSri LankanSubsaharan AfricanSudaneseSwedishSwissSyrianTaiwaneseThaiTlingit-HaidaTohono O'OdhamTonganTrinidadian and TobagonianTsimshianTurkishU.S. Virgin IslanderUgandanUkrainianUruguayanUteVenezuelanVietnameseWelshWest IndianYakamaYaquiYugoslavianYumanYup'ikZimbabwean
Immigration
NonimmigrantsImmigrantsAfghanistanAfricaAlbaniaArgentinaArmeniaAsiaAustraliaAustriaBahamasBangladeshBarbadosBelarusBelgiumBelizeBoliviaBosnia and HerzegovinaBrazilBulgariaBurma/MyanmarCabo VerdeCambodiaCameroonCanadaCaribbeanCentral AmericaChileChinaColombiaCongoCosta RicaCroatiaCubaCzechoslovakiaDenmarkDominicaDominican RepublicEastern AfricaEastern AsiaEastern EuropeEcuadorEgyptEl SalvadorEnglandEritreaEthiopiaEuropeFijiFranceGermanyGhanaGreeceGrenadaGuatemalaGuyanaHaitiHondurasHong KongHungaryIndiaIndonesiaIranIraqIrelandIsraelItalyJamaicaJapanJordanKazakhstanKenyaKoreaKuwaitLaosLatin AmericaLatviaLebanonLiberiaLithuaniaMalaysiaMexicoMicronesiaMiddle AfricaMoldovaMoroccoNepalNetherlandsNicaraguaNigeriaNorth AmericaNorth MacedoniaNorthern AfricaNorthern EuropeNorwayOceaniaPakistanPanamaPeruPhilippinesPolandPortugalRomaniaRussiaSaudi ArabiaScotlandSenegalSerbiaSierra LeoneSingaporeSomaliaSouth AfricaSouth AmericaSouth Central AsiaSouth Eastern AsiaSouthern EuropeSpainSri LankaSt. Vincent and the GrenadinesSudanSwedenSwitzerlandSyriaTaiwanThailandTrinidad and TobagoTurkeyUgandaUkraineUruguayUzbekistanVenezuelaVietnamWest IndiesWestern AfricaWestern AsiaWestern EuropeYemenZaireZimbabweAzores
Czech
Race
Ancestry
AfghanAfricanAlaska NativeAlaskan AthabascanAlbanianAleutAlsatianAmericanApacheArabArapahoArgentineanArmenianAssyrian/Chaldean/SyriacAustralianAustrianBahamianBangladeshiBarbadianBasqueBelgianBelizeanBermudanBhutaneseBlackfeetBolivianBrazilianBritishBritish West IndianBulgarianBurmeseCajunCambodianCanadianCape VerdeanCarpatho RusynCelticCentral AmericanCentral American IndianCherokeeCheyenneChickasawChileanChineseChippewaChoctawColombianColvilleComancheCosta RicanCreeCreekCroatianCrowCubanCypriotCzechCzechoslovakianDanishDelawareDominicanDutchDutch West IndianEastern EuropeanEcuadorianEgyptianEnglishEstonianEthiopianEuropeanFijianFilipinoFinnishFrenchFrench American IndianFrench CanadianGermanGerman RussianGhanaianGreekGuamanian/ChamorroGuatemalanGuyaneseHaitianHmongHonduranHopiHoumaHungarianIcelanderIndian (Asian)IndonesianInupiatIranianIraqiIrishIroquoisIsraeliItalianJamaicanJapaneseJordanianKenyanKiowaKoreanLaotianLatvianLebaneseLiberianLithuanianLumbeeLuxembourgerMacedonianMalaysianMalteseMarshalleseMenomineeMexicanMexican American IndianMongolianMoroccanNative HawaiianNavajoNepaleseNew ZealanderNicaraguanNigerianNorthern EuropeanNorwegianOkinawanOsageOttawaPaiutePakistaniPalestinianPanamanianParaguayanPennsylvania GermanPeruvianPimaPolishPortuguesePotawatomiPuebloPuerto RicanPuget Sound SalishRomanianRussianSalvadoranSamoanScandinavianScotch-IrishScottishSeminoleSenegaleseSerbianShoshoneSierra LeoneanSiouxSlavicSlovakSloveneSomaliSouth AfricanSouth AmericanSouth American IndianSoviet UnionSpaniardSpanishSpanish AmericanSpanish American IndianSri LankanSubsaharan AfricanSudaneseSwedishSwissSyrianTaiwaneseThaiTlingit-HaidaTohono O'OdhamTonganTrinidadian and TobagonianTsimshianTurkishU.S. Virgin IslanderUgandanUkrainianUruguayanUteVenezuelanVietnameseWelshWest IndianYakamaYaquiYugoslavianYumanYup'ikZimbabwean
Immigration
NonimmigrantsImmigrantsAfghanistanAfricaAlbaniaArgentinaArmeniaAsiaAustraliaAustriaBahamasBangladeshBarbadosBelarusBelgiumBelizeBoliviaBosnia and HerzegovinaBrazilBulgariaBurma/MyanmarCabo VerdeCambodiaCanadaCaribbeanCentral AmericaChileChinaColombiaCongoCosta RicaCroatiaCubaCzechoslovakiaDenmarkDominicaDominican RepublicEastern AfricaEastern AsiaEastern EuropeEcuadorEgyptEl SalvadorEnglandEritreaEthiopiaEuropeFijiFranceGermanyGhanaGreeceGrenadaGuatemalaGuyanaHaitiHondurasHong KongHungaryIndiaIndonesiaIranIraqIrelandIsraelItalyJamaicaJapanJordanKazakhstanKenyaKoreaKuwaitLaosLatin AmericaLatviaLebanonLiberiaLithuaniaMalaysiaMexicoMicronesiaMiddle AfricaMoldovaMoroccoNepalNetherlandsNicaraguaNigeriaNorth AmericaNorth MacedoniaNorthern AfricaNorthern EuropeNorwayOceaniaPakistanPanamaPeruPhilippinesPolandPortugalRomaniaRussiaSaudi ArabiaScotlandSenegalSerbiaSierra LeoneSingaporeSomaliaSouth AfricaSouth AmericaSouth Central AsiaSouth Eastern AsiaSouthern EuropeSpainSri LankaSt. Vincent and the GrenadinesSudanSwedenSwitzerlandSyriaTaiwanThailandTrinidad and TobagoTurkeyUgandaUkraineUruguayUzbekistanVenezuelaVietnamWest IndiesWestern AfricaWestern AsiaWestern EuropeYemenZaireZimbabweAzores
Disability Age 65 to 74
Income
Poverty
Unemployment
Labor Participation
Family Structure
Vehicle Availability
Education Level
Disability

Disability Age 65 to 74 Comparison

Immigrants from Cameroon

Czechs

Good
Exceptional
23.1%
DISABILITY AGE 65 TO 74
63.8/ 100
METRIC RATING
161st/ 347
METRIC RANK
22.4%
DISABILITY AGE 65 TO 74
93.5/ 100
METRIC RATING
121st/ 347
METRIC RANK

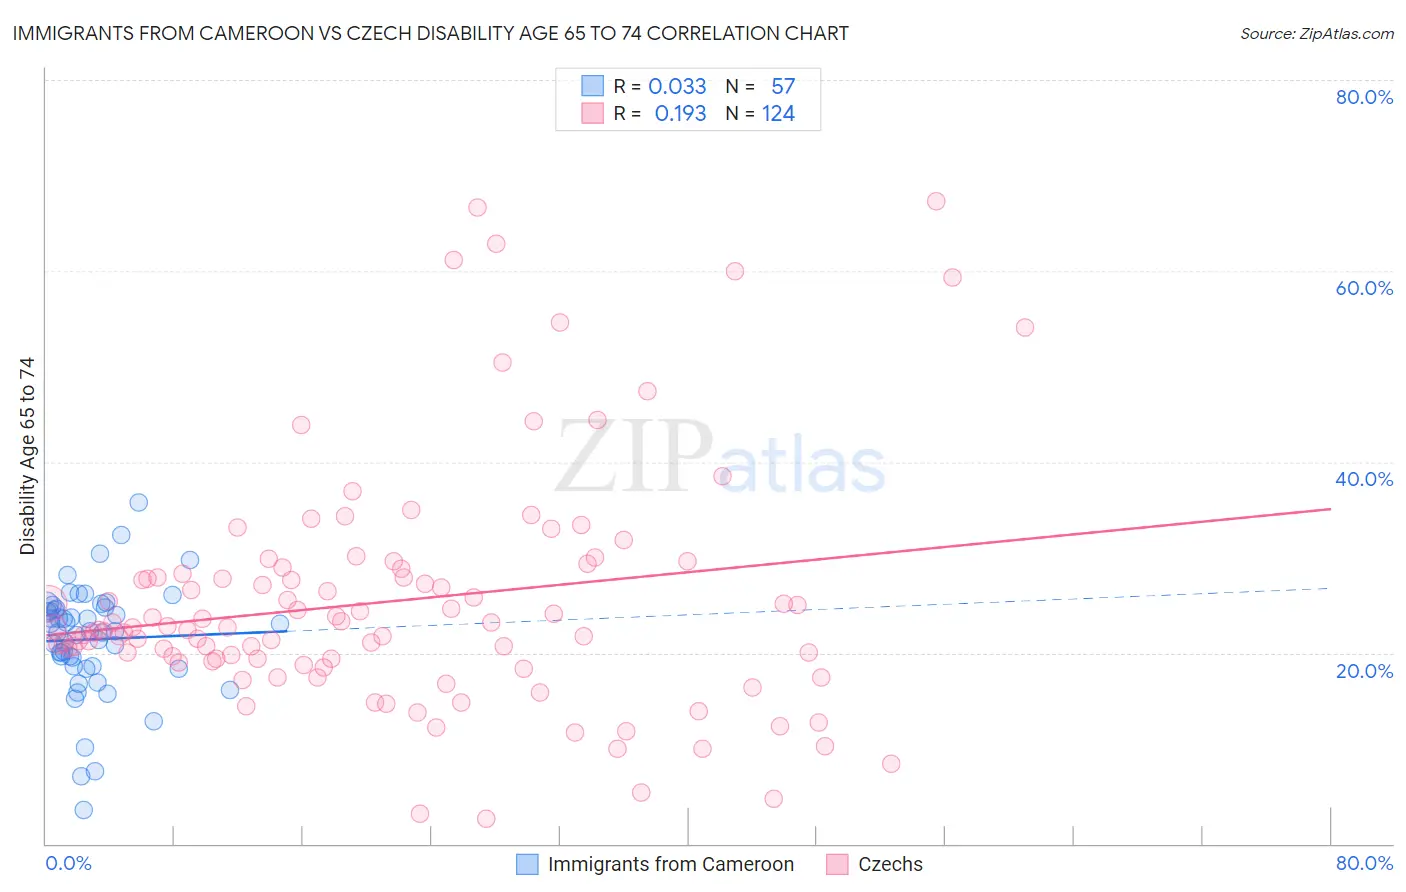
Immigrants from Cameroon vs Czech Disability Age 65 to 74 Correlation Chart

The statistical analysis conducted on geographies consisting of 130,578,775 people shows no correlation between the proportion of Immigrants from Cameroon and percentage of population with a disability between the ages 65 and 75 in the United States with a correlation coefficient (R) of 0.033 and weighted average of 23.1%. Similarly, the statistical analysis conducted on geographies consisting of 483,519,300 people shows a poor positive correlation between the proportion of Czechs and percentage of population with a disability between the ages 65 and 75 in the United States with a correlation coefficient (R) of 0.193 and weighted average of 22.4%, a difference of 3.2%.
Immigrants from Cameroon vs Czech Disability Age 65 to 74

Disability Age 65 to 74 Correlation Summary

MeasurementImmigrants from CameroonCzech
Minimum3.5%2.7%
Maximum35.8%67.3%
Range32.3%64.7%
Mean21.4%25.4%
Median22.3%22.6%
Interquartile 25% (IQ1)18.6%19.3%
Interquartile 75% (IQ3)24.7%28.6%
Interquartile Range (IQR)6.1%9.3%
Standard Deviation (Sample)5.8%12.5%
Standard Deviation (Population)5.8%12.4%

Similar Demographics by Disability Age 65 to 74

Demographics Similar to Immigrants from Cameroon by Disability Age 65 to 74

In terms of disability age 65 to 74, the demographic groups most similar to Immigrants from Cameroon are Korean (23.1%, a difference of 0.030%), South American Indian (23.1%, a difference of 0.11%), European (23.2%, a difference of 0.16%), Immigrants from Philippines (23.2%, a difference of 0.16%), and Sierra Leonean (23.2%, a difference of 0.18%).
DemographicsRating | RankDisability Age 65 to 74
Sri Lankans
74.0
/100
|
#154
Good
23.0%
British
73.9
/100
|
#155
Good
23.0%
Immigrants | Western Asia
73.8
/100
|
#156
Good
23.0%
Czechoslovakians
72.4
/100
|
#157
Good
23.0%
Immigrants | Vietnam
69.1
/100
|
#158
Good
23.1%
South American Indians
65.5
/100
|
#159
Good
23.1%
Koreans
64.2
/100
|
#160
Good
23.1%
Immigrants | Cameroon
63.8
/100
|
#161
Good
23.1%
Europeans
61.2
/100
|
#162
Good
23.2%
Immigrants | Philippines
61.1
/100
|
#163
Good
23.2%
Sierra Leoneans
60.9
/100
|
#164
Good
23.2%
Vietnamese
60.8
/100
|
#165
Good
23.2%
Immigrants | Afghanistan
60.5
/100
|
#166
Good
23.2%
Immigrants | Bosnia and Herzegovina
57.6
/100
|
#167
Average
23.2%
Pakistanis
57.0
/100
|
#168
Average
23.2%

Demographics Similar to Czechs by Disability Age 65 to 74

In terms of disability age 65 to 74, the demographic groups most similar to Czechs are Immigrants from Jordan (22.4%, a difference of 0.0%), Hungarian (22.4%, a difference of 0.050%), Immigrants from Kazakhstan (22.4%, a difference of 0.10%), Norwegian (22.5%, a difference of 0.24%), and Immigrants from Western Europe (22.5%, a difference of 0.28%).
DemographicsRating | RankDisability Age 65 to 74
Ukrainians
95.1
/100
|
#114
Exceptional
22.3%
Laotians
94.9
/100
|
#115
Exceptional
22.3%
Brazilians
94.8
/100
|
#116
Exceptional
22.4%
Swedes
94.7
/100
|
#117
Exceptional
22.4%
Austrians
94.7
/100
|
#118
Exceptional
22.4%
Immigrants | Northern Africa
94.7
/100
|
#119
Exceptional
22.4%
Immigrants | Kazakhstan
93.9
/100
|
#120
Exceptional
22.4%
Czechs
93.5
/100
|
#121
Exceptional
22.4%
Immigrants | Jordan
93.5
/100
|
#122
Exceptional
22.4%
Hungarians
93.3
/100
|
#123
Exceptional
22.4%
Norwegians
92.5
/100
|
#124
Exceptional
22.5%
Immigrants | Western Europe
92.3
/100
|
#125
Exceptional
22.5%
Lebanese
92.2
/100
|
#126
Exceptional
22.5%
Slovaks
91.6
/100
|
#127
Exceptional
22.5%
Immigrants | Costa Rica
90.4
/100
|
#128
Exceptional
22.6%