Cheyenne vs Czech Disability Age 65 to 74
COMPARE
Cheyenne
Czech
Disability Age 65 to 74
Disability Age 65 to 74 Comparison
Cheyenne
Czechs
31.1%
DISABILITY AGE 65 TO 74
0.0/ 100
METRIC RATING
335th/ 347
METRIC RANK
22.4%
DISABILITY AGE 65 TO 74
93.5/ 100
METRIC RATING
121st/ 347
METRIC RANK
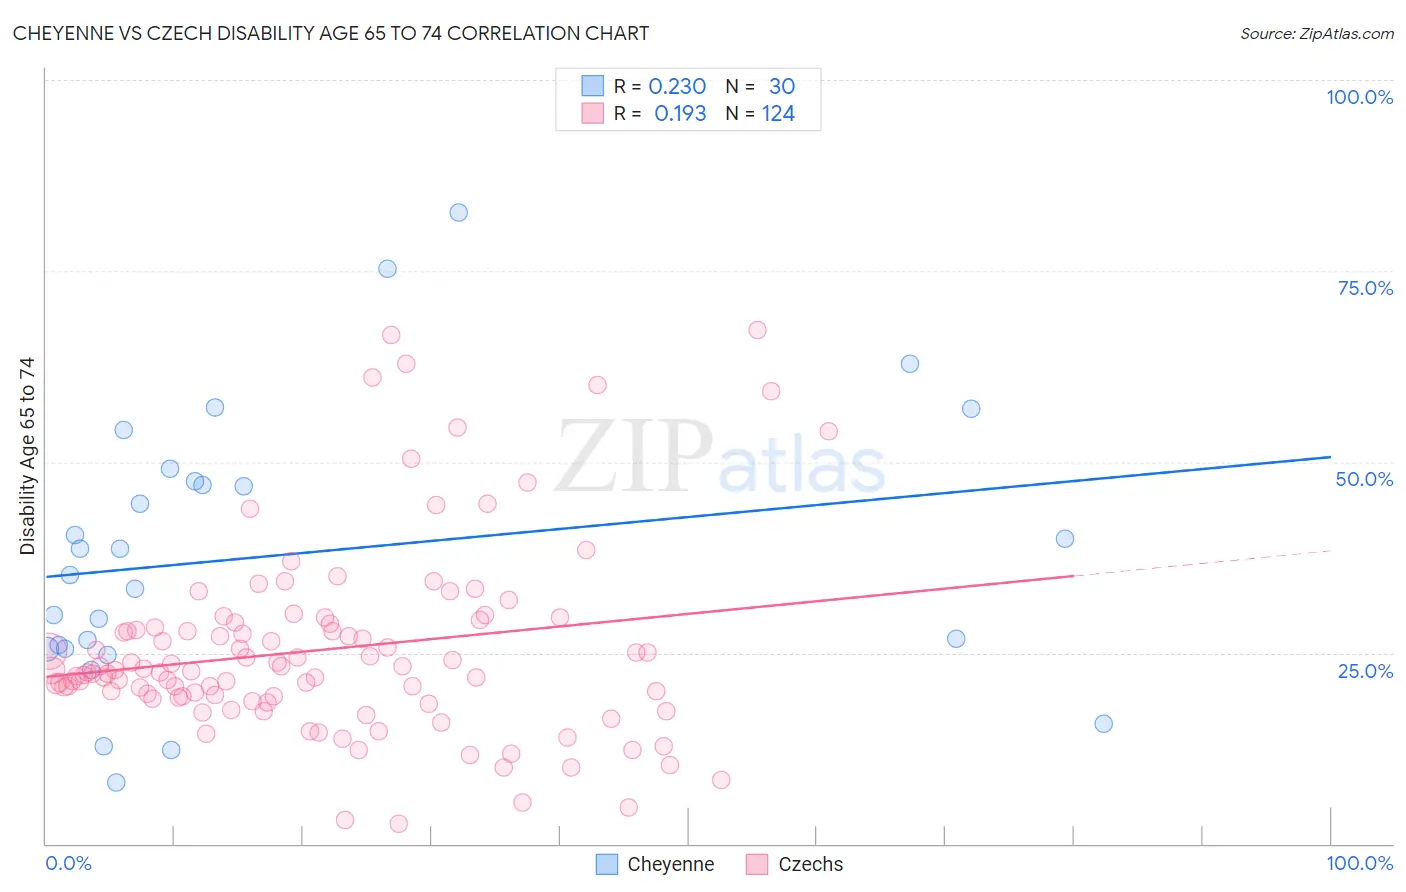
Cheyenne vs Czech Disability Age 65 to 74 Correlation Chart
The statistical analysis conducted on geographies consisting of 80,698,325 people shows a weak positive correlation between the proportion of Cheyenne and percentage of population with a disability between the ages 65 and 75 in the United States with a correlation coefficient (R) of 0.230 and weighted average of 31.1%. Similarly, the statistical analysis conducted on geographies consisting of 483,519,300 people shows a poor positive correlation between the proportion of Czechs and percentage of population with a disability between the ages 65 and 75 in the United States with a correlation coefficient (R) of 0.193 and weighted average of 22.4%, a difference of 38.5%.
Disability Age 65 to 74 Correlation Summary
| Measurement | Cheyenne | Czech |
| Minimum | 8.0% | 2.7% |
| Maximum | 82.6% | 67.3% |
| Range | 74.6% | 64.7% |
| Mean | 37.9% | 25.4% |
| Median | 36.9% | 22.6% |
| Interquartile 25% (IQ1) | 25.5% | 19.3% |
| Interquartile 75% (IQ3) | 47.5% | 28.6% |
| Interquartile Range (IQR) | 22.0% | 9.3% |
| Standard Deviation (Sample) | 18.0% | 12.5% |
| Standard Deviation (Population) | 17.7% | 12.4% |
Similar Demographics by Disability Age 65 to 74
Demographics Similar to Cheyenne by Disability Age 65 to 74
In terms of disability age 65 to 74, the demographic groups most similar to Cheyenne are Yuman (31.5%, a difference of 1.3%), Alaska Native (30.6%, a difference of 1.4%), Colville (30.5%, a difference of 1.7%), Native/Alaskan (30.4%, a difference of 2.2%), and Chickasaw (30.2%, a difference of 2.9%).
| Demographics | Rating | Rank | Disability Age 65 to 74 |
| Hopi | 0.0 /100 | #328 | Tragic 30.0% |
| Choctaw | 0.0 /100 | #329 | Tragic 30.2% |
| Creek | 0.0 /100 | #330 | Tragic 30.2% |
| Chickasaw | 0.0 /100 | #331 | Tragic 30.2% |
| Natives/Alaskans | 0.0 /100 | #332 | Tragic 30.4% |
| Colville | 0.0 /100 | #333 | Tragic 30.5% |
| Alaska Natives | 0.0 /100 | #334 | Tragic 30.6% |
| Cheyenne | 0.0 /100 | #335 | Tragic 31.1% |
| Yuman | 0.0 /100 | #336 | Tragic 31.5% |
| Houma | 0.0 /100 | #337 | Tragic 32.3% |
| Alaskan Athabascans | 0.0 /100 | #338 | Tragic 32.4% |
| Kiowa | 0.0 /100 | #339 | Tragic 32.6% |
| Lumbee | 0.0 /100 | #340 | Tragic 32.7% |
| Tsimshian | 0.0 /100 | #341 | Tragic 32.9% |
| Pueblo | 0.0 /100 | #342 | Tragic 33.1% |
Demographics Similar to Czechs by Disability Age 65 to 74
In terms of disability age 65 to 74, the demographic groups most similar to Czechs are Immigrants from Jordan (22.4%, a difference of 0.0%), Hungarian (22.4%, a difference of 0.050%), Immigrants from Kazakhstan (22.4%, a difference of 0.10%), Norwegian (22.5%, a difference of 0.24%), and Immigrants from Western Europe (22.5%, a difference of 0.28%).
| Demographics | Rating | Rank | Disability Age 65 to 74 |
| Ukrainians | 95.1 /100 | #114 | Exceptional 22.3% |
| Laotians | 94.9 /100 | #115 | Exceptional 22.3% |
| Brazilians | 94.8 /100 | #116 | Exceptional 22.4% |
| Swedes | 94.7 /100 | #117 | Exceptional 22.4% |
| Austrians | 94.7 /100 | #118 | Exceptional 22.4% |
| Immigrants | Northern Africa | 94.7 /100 | #119 | Exceptional 22.4% |
| Immigrants | Kazakhstan | 93.9 /100 | #120 | Exceptional 22.4% |
| Czechs | 93.5 /100 | #121 | Exceptional 22.4% |
| Immigrants | Jordan | 93.5 /100 | #122 | Exceptional 22.4% |
| Hungarians | 93.3 /100 | #123 | Exceptional 22.4% |
| Norwegians | 92.5 /100 | #124 | Exceptional 22.5% |
| Immigrants | Western Europe | 92.3 /100 | #125 | Exceptional 22.5% |
| Lebanese | 92.2 /100 | #126 | Exceptional 22.5% |
| Slovaks | 91.6 /100 | #127 | Exceptional 22.5% |
| Immigrants | Costa Rica | 90.4 /100 | #128 | Exceptional 22.6% |