Subsaharan African vs Bulgarian Associate's Degree
COMPARE
Subsaharan African
Bulgarian
Associate's Degree
Associate's Degree Comparison
Sub-Saharan Africans
Bulgarians
43.9%
ASSOCIATE'S DEGREE
5.5/ 100
METRIC RATING
223rd/ 347
METRIC RANK
53.3%
ASSOCIATE'S DEGREE
100.0/ 100
METRIC RATING
34th/ 347
METRIC RANK
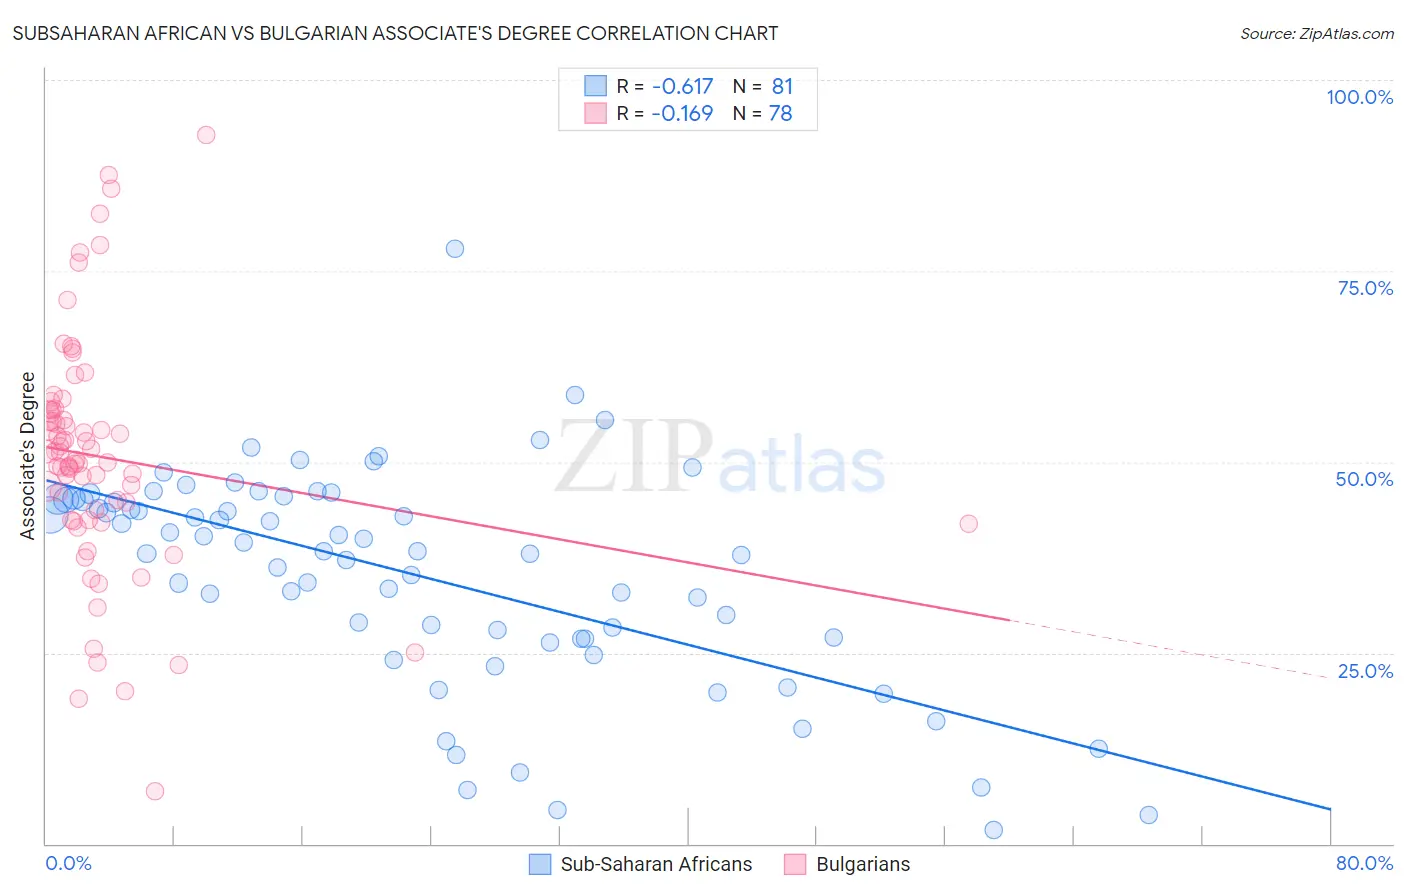
Subsaharan African vs Bulgarian Associate's Degree Correlation Chart
The statistical analysis conducted on geographies consisting of 508,152,134 people shows a significant negative correlation between the proportion of Sub-Saharan Africans and percentage of population with at least associate's degree education in the United States with a correlation coefficient (R) of -0.617 and weighted average of 43.9%. Similarly, the statistical analysis conducted on geographies consisting of 205,619,803 people shows a poor negative correlation between the proportion of Bulgarians and percentage of population with at least associate's degree education in the United States with a correlation coefficient (R) of -0.169 and weighted average of 53.3%, a difference of 21.4%.
Associate's Degree Correlation Summary
| Measurement | Subsaharan African | Bulgarian |
| Minimum | 1.7% | 6.9% |
| Maximum | 78.0% | 92.7% |
| Range | 76.2% | 85.9% |
| Mean | 35.2% | 50.7% |
| Median | 38.3% | 50.7% |
| Interquartile 25% (IQ1) | 26.9% | 42.4% |
| Interquartile 75% (IQ3) | 45.1% | 56.8% |
| Interquartile Range (IQR) | 18.2% | 14.4% |
| Standard Deviation (Sample) | 14.2% | 15.5% |
| Standard Deviation (Population) | 14.1% | 15.4% |
Similar Demographics by Associate's Degree
Demographics Similar to Sub-Saharan Africans by Associate's Degree
In terms of associate's degree, the demographic groups most similar to Sub-Saharan Africans are Barbadian (43.9%, a difference of 0.10%), West Indian (43.8%, a difference of 0.14%), Guamanian/Chamorro (43.8%, a difference of 0.29%), Immigrants from Western Africa (44.1%, a difference of 0.37%), and Immigrants from Burma/Myanmar (43.7%, a difference of 0.51%).
| Demographics | Rating | Rank | Associate's Degree |
| Immigrants | Nigeria | 11.4 /100 | #216 | Poor 44.6% |
| Immigrants | Immigrants | 10.5 /100 | #217 | Poor 44.5% |
| Spanish | 9.4 /100 | #218 | Tragic 44.4% |
| Whites/Caucasians | 7.5 /100 | #219 | Tragic 44.2% |
| Portuguese | 7.2 /100 | #220 | Tragic 44.1% |
| Immigrants | Western Africa | 6.6 /100 | #221 | Tragic 44.1% |
| Barbadians | 5.8 /100 | #222 | Tragic 43.9% |
| Sub-Saharan Africans | 5.5 /100 | #223 | Tragic 43.9% |
| West Indians | 5.2 /100 | #224 | Tragic 43.8% |
| Guamanians/Chamorros | 4.8 /100 | #225 | Tragic 43.8% |
| Immigrants | Burma/Myanmar | 4.3 /100 | #226 | Tragic 43.7% |
| Trinidadians and Tobagonians | 4.0 /100 | #227 | Tragic 43.6% |
| Hmong | 3.2 /100 | #228 | Tragic 43.4% |
| Immigrants | Trinidad and Tobago | 3.0 /100 | #229 | Tragic 43.3% |
| Immigrants | Barbados | 2.9 /100 | #230 | Tragic 43.3% |
Demographics Similar to Bulgarians by Associate's Degree
In terms of associate's degree, the demographic groups most similar to Bulgarians are Russian (53.2%, a difference of 0.060%), Israeli (53.4%, a difference of 0.19%), Immigrants from Turkey (53.4%, a difference of 0.31%), Immigrants from Northern Europe (53.5%, a difference of 0.34%), and Immigrants from Russia (53.1%, a difference of 0.35%).
| Demographics | Rating | Rank | Associate's Degree |
| Latvians | 100.0 /100 | #27 | Exceptional 53.9% |
| Turks | 100.0 /100 | #28 | Exceptional 53.9% |
| Immigrants | France | 100.0 /100 | #29 | Exceptional 53.9% |
| Immigrants | Sri Lanka | 100.0 /100 | #30 | Exceptional 53.7% |
| Immigrants | Northern Europe | 100.0 /100 | #31 | Exceptional 53.5% |
| Immigrants | Turkey | 100.0 /100 | #32 | Exceptional 53.4% |
| Israelis | 100.0 /100 | #33 | Exceptional 53.4% |
| Bulgarians | 100.0 /100 | #34 | Exceptional 53.3% |
| Russians | 100.0 /100 | #35 | Exceptional 53.2% |
| Immigrants | Russia | 100.0 /100 | #36 | Exceptional 53.1% |
| Immigrants | Denmark | 100.0 /100 | #37 | Exceptional 53.1% |
| Mongolians | 100.0 /100 | #38 | Exceptional 53.0% |
| Immigrants | Belarus | 99.9 /100 | #39 | Exceptional 52.8% |
| Immigrants | Latvia | 99.9 /100 | #40 | Exceptional 52.8% |
| Immigrants | Saudi Arabia | 99.9 /100 | #41 | Exceptional 52.6% |