Subsaharan African vs Bulgarian 4th Grade
COMPARE
Subsaharan African
Bulgarian
4th Grade
4th Grade Comparison
Sub-Saharan Africans
Bulgarians
97.2%
4TH GRADE
3.6/ 100
METRIC RATING
228th/ 347
METRIC RANK
98.1%
4TH GRADE
99.8/ 100
METRIC RATING
49th/ 347
METRIC RANK
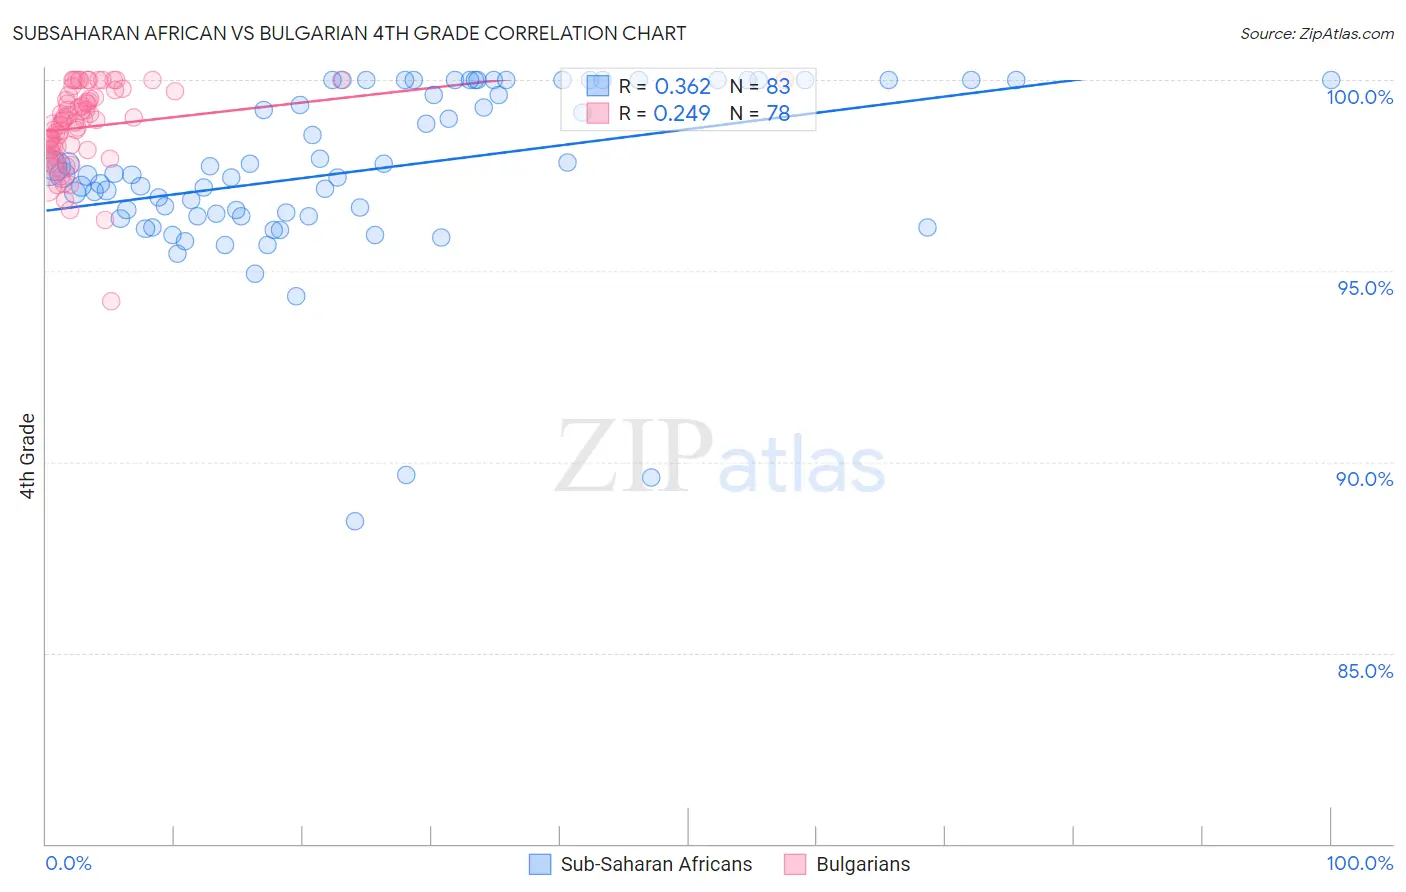
Subsaharan African vs Bulgarian 4th Grade Correlation Chart
The statistical analysis conducted on geographies consisting of 508,209,362 people shows a mild positive correlation between the proportion of Sub-Saharan Africans and percentage of population with at least 4th grade education in the United States with a correlation coefficient (R) of 0.362 and weighted average of 97.2%. Similarly, the statistical analysis conducted on geographies consisting of 205,633,223 people shows a weak positive correlation between the proportion of Bulgarians and percentage of population with at least 4th grade education in the United States with a correlation coefficient (R) of 0.249 and weighted average of 98.1%, a difference of 0.91%.
4th Grade Correlation Summary
| Measurement | Subsaharan African | Bulgarian |
| Minimum | 88.4% | 94.2% |
| Maximum | 100.0% | 100.0% |
| Range | 11.6% | 5.8% |
| Mean | 97.6% | 98.8% |
| Median | 97.5% | 98.9% |
| Interquartile 25% (IQ1) | 96.4% | 98.2% |
| Interquartile 75% (IQ3) | 100.0% | 99.5% |
| Interquartile Range (IQR) | 3.6% | 1.4% |
| Standard Deviation (Sample) | 2.3% | 1.1% |
| Standard Deviation (Population) | 2.3% | 1.1% |
Similar Demographics by 4th Grade
Demographics Similar to Sub-Saharan Africans by 4th Grade
In terms of 4th grade, the demographic groups most similar to Sub-Saharan Africans are Immigrants from Pakistan (97.2%, a difference of 0.0%), Liberian (97.2%, a difference of 0.0%), Uruguayan (97.2%, a difference of 0.0%), Bahamian (97.2%, a difference of 0.010%), and Immigrants from Malaysia (97.2%, a difference of 0.010%).
| Demographics | Rating | Rank | 4th Grade |
| Immigrants | Panama | 5.4 /100 | #221 | Tragic 97.3% |
| Immigrants | Lebanon | 5.1 /100 | #222 | Tragic 97.3% |
| Immigrants | Sudan | 5.0 /100 | #223 | Tragic 97.2% |
| Immigrants | Syria | 5.0 /100 | #224 | Tragic 97.2% |
| Immigrants | Iraq | 4.6 /100 | #225 | Tragic 97.2% |
| Bahamians | 3.8 /100 | #226 | Tragic 97.2% |
| Immigrants | Pakistan | 3.7 /100 | #227 | Tragic 97.2% |
| Sub-Saharan Africans | 3.6 /100 | #228 | Tragic 97.2% |
| Liberians | 3.6 /100 | #229 | Tragic 97.2% |
| Uruguayans | 3.5 /100 | #230 | Tragic 97.2% |
| Immigrants | Malaysia | 3.4 /100 | #231 | Tragic 97.2% |
| Immigrants | Western Asia | 3.4 /100 | #232 | Tragic 97.2% |
| Senegalese | 3.1 /100 | #233 | Tragic 97.2% |
| Assyrians/Chaldeans/Syriacs | 3.0 /100 | #234 | Tragic 97.2% |
| Yuman | 2.9 /100 | #235 | Tragic 97.2% |
Demographics Similar to Bulgarians by 4th Grade
In terms of 4th grade, the demographic groups most similar to Bulgarians are Estonian (98.1%, a difference of 0.0%), Immigrants from Scotland (98.1%, a difference of 0.0%), Celtic (98.1%, a difference of 0.010%), Australian (98.1%, a difference of 0.010%), and Slavic (98.1%, a difference of 0.010%).
| Demographics | Rating | Rank | 4th Grade |
| Hungarians | 99.9 /100 | #42 | Exceptional 98.2% |
| Northern Europeans | 99.9 /100 | #43 | Exceptional 98.2% |
| Native Hawaiians | 99.9 /100 | #44 | Exceptional 98.1% |
| Czechoslovakians | 99.9 /100 | #45 | Exceptional 98.1% |
| Ottawa | 99.9 /100 | #46 | Exceptional 98.1% |
| Arapaho | 99.9 /100 | #47 | Exceptional 98.1% |
| Estonians | 99.8 /100 | #48 | Exceptional 98.1% |
| Bulgarians | 99.8 /100 | #49 | Exceptional 98.1% |
| Immigrants | Scotland | 99.8 /100 | #50 | Exceptional 98.1% |
| Celtics | 99.8 /100 | #51 | Exceptional 98.1% |
| Australians | 99.8 /100 | #52 | Exceptional 98.1% |
| Slavs | 99.8 /100 | #53 | Exceptional 98.1% |
| Maltese | 99.8 /100 | #54 | Exceptional 98.1% |
| Whites/Caucasians | 99.8 /100 | #55 | Exceptional 98.1% |
| Greeks | 99.8 /100 | #56 | Exceptional 98.1% |