Spaniard vs Immigrants from Canada Self-Care Disability
COMPARE
Spaniard
Immigrants from Canada
Self-Care Disability
Self-Care Disability Comparison
Spaniards
Immigrants from Canada
2.6%
SELF-CARE DISABILITY
3.8/ 100
METRIC RATING
222nd/ 347
METRIC RANK
2.4%
SELF-CARE DISABILITY
92.0/ 100
METRIC RATING
118th/ 347
METRIC RANK
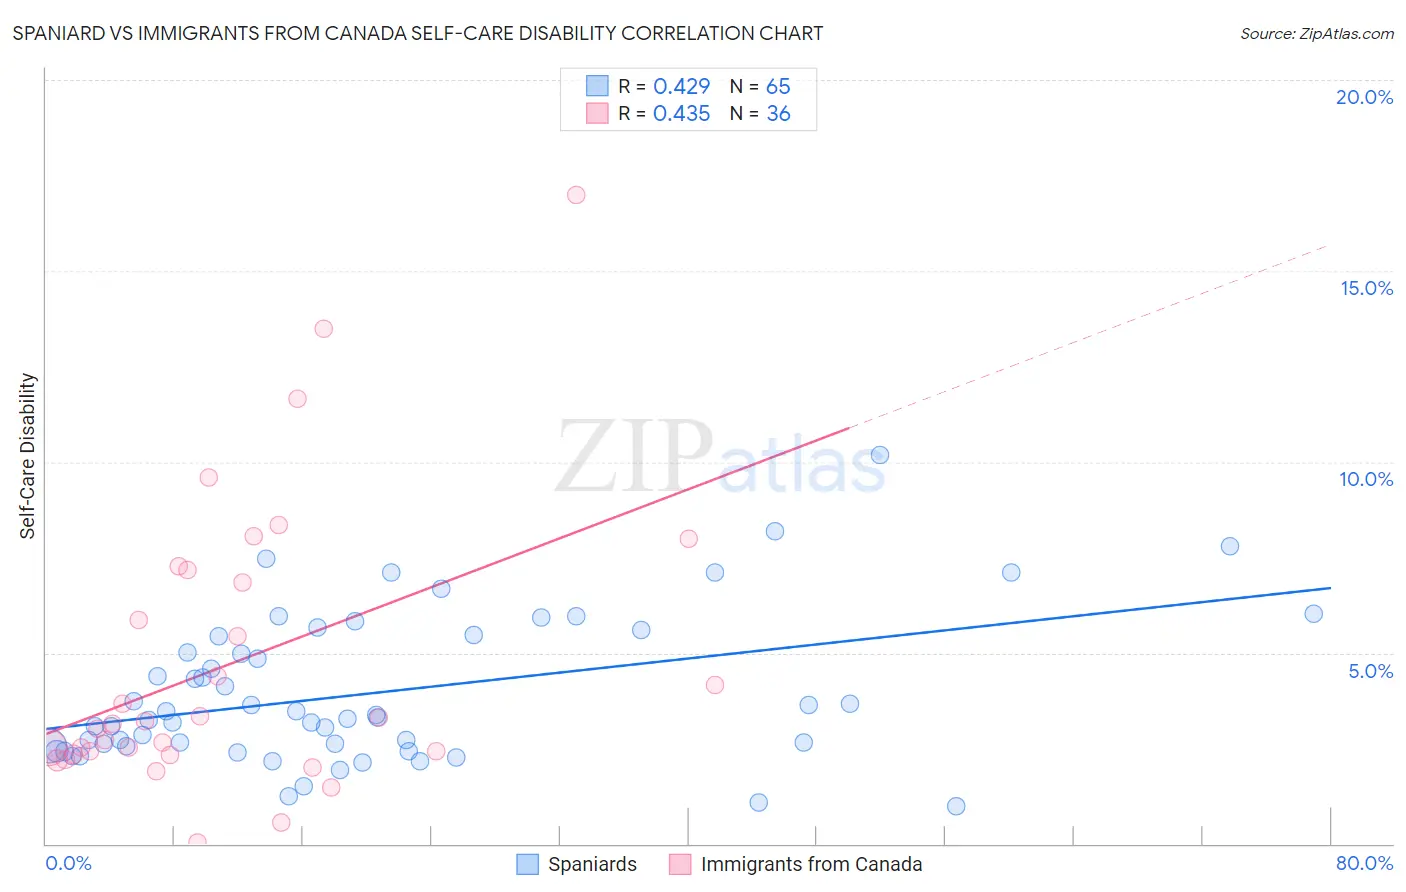
Spaniard vs Immigrants from Canada Self-Care Disability Correlation Chart
The statistical analysis conducted on geographies consisting of 442,715,832 people shows a moderate positive correlation between the proportion of Spaniards and percentage of population with self-care disability in the United States with a correlation coefficient (R) of 0.429 and weighted average of 2.6%. Similarly, the statistical analysis conducted on geographies consisting of 458,661,407 people shows a moderate positive correlation between the proportion of Immigrants from Canada and percentage of population with self-care disability in the United States with a correlation coefficient (R) of 0.435 and weighted average of 2.4%, a difference of 7.0%.
Self-Care Disability Correlation Summary
| Measurement | Spaniard | Immigrants from Canada |
| Minimum | 0.97% | 0.045% |
| Maximum | 10.2% | 17.0% |
| Range | 9.2% | 17.0% |
| Mean | 3.9% | 4.7% |
| Median | 3.3% | 3.2% |
| Interquartile 25% (IQ1) | 2.6% | 2.4% |
| Interquartile 75% (IQ3) | 5.4% | 7.0% |
| Interquartile Range (IQR) | 2.9% | 4.6% |
| Standard Deviation (Sample) | 1.9% | 3.7% |
| Standard Deviation (Population) | 1.9% | 3.7% |
Similar Demographics by Self-Care Disability
Demographics Similar to Spaniards by Self-Care Disability
In terms of self-care disability, the demographic groups most similar to Spaniards are French Canadian (2.6%, a difference of 0.0%), Honduran (2.6%, a difference of 0.010%), Subsaharan African (2.6%, a difference of 0.050%), Immigrants from Moldova (2.6%, a difference of 0.060%), and Osage (2.6%, a difference of 0.060%).
| Demographics | Rating | Rank | Self-Care Disability |
| Immigrants | Thailand | 4.5 /100 | #215 | Tragic 2.6% |
| Whites/Caucasians | 4.4 /100 | #216 | Tragic 2.6% |
| Celtics | 4.4 /100 | #217 | Tragic 2.6% |
| Scotch-Irish | 4.1 /100 | #218 | Tragic 2.6% |
| Immigrants | Moldova | 4.0 /100 | #219 | Tragic 2.6% |
| Sub-Saharan Africans | 4.0 /100 | #220 | Tragic 2.6% |
| Hondurans | 3.8 /100 | #221 | Tragic 2.6% |
| Spaniards | 3.8 /100 | #222 | Tragic 2.6% |
| French Canadians | 3.8 /100 | #223 | Tragic 2.6% |
| Osage | 3.6 /100 | #224 | Tragic 2.6% |
| Iraqis | 3.2 /100 | #225 | Tragic 2.6% |
| Chinese | 2.9 /100 | #226 | Tragic 2.6% |
| Immigrants | Philippines | 2.7 /100 | #227 | Tragic 2.6% |
| Guatemalans | 2.7 /100 | #228 | Tragic 2.6% |
| Guamanians/Chamorros | 2.5 /100 | #229 | Tragic 2.6% |
Demographics Similar to Immigrants from Canada by Self-Care Disability
In terms of self-care disability, the demographic groups most similar to Immigrants from Canada are Immigrants from Sierra Leone (2.4%, a difference of 0.030%), Uruguayan (2.4%, a difference of 0.080%), Taiwanese (2.4%, a difference of 0.090%), Peruvian (2.4%, a difference of 0.11%), and Northern European (2.4%, a difference of 0.15%).
| Demographics | Rating | Rank | Self-Care Disability |
| Serbians | 93.6 /100 | #111 | Exceptional 2.4% |
| Scandinavians | 93.5 /100 | #112 | Exceptional 2.4% |
| South Americans | 93.2 /100 | #113 | Exceptional 2.4% |
| Immigrants | North Macedonia | 93.1 /100 | #114 | Exceptional 2.4% |
| Immigrants | Hong Kong | 93.1 /100 | #115 | Exceptional 2.4% |
| Northern Europeans | 92.9 /100 | #116 | Exceptional 2.4% |
| Taiwanese | 92.5 /100 | #117 | Exceptional 2.4% |
| Immigrants | Canada | 92.0 /100 | #118 | Exceptional 2.4% |
| Immigrants | Sierra Leone | 91.8 /100 | #119 | Exceptional 2.4% |
| Uruguayans | 91.5 /100 | #120 | Exceptional 2.4% |
| Peruvians | 91.3 /100 | #121 | Exceptional 2.4% |
| Belgians | 90.9 /100 | #122 | Exceptional 2.4% |
| Immigrants | Nigeria | 90.3 /100 | #123 | Exceptional 2.4% |
| Immigrants | North America | 90.2 /100 | #124 | Exceptional 2.4% |
| Immigrants | Morocco | 90.2 /100 | #124 | Exceptional 2.4% |