Spaniard vs Immigrants from France Self-Care Disability
COMPARE
Spaniard
Immigrants from France
Self-Care Disability
Self-Care Disability Comparison
Spaniards
Immigrants from France
2.6%
SELF-CARE DISABILITY
3.8/ 100
METRIC RATING
222nd/ 347
METRIC RANK
2.3%
SELF-CARE DISABILITY
99.6/ 100
METRIC RATING
55th/ 347
METRIC RANK
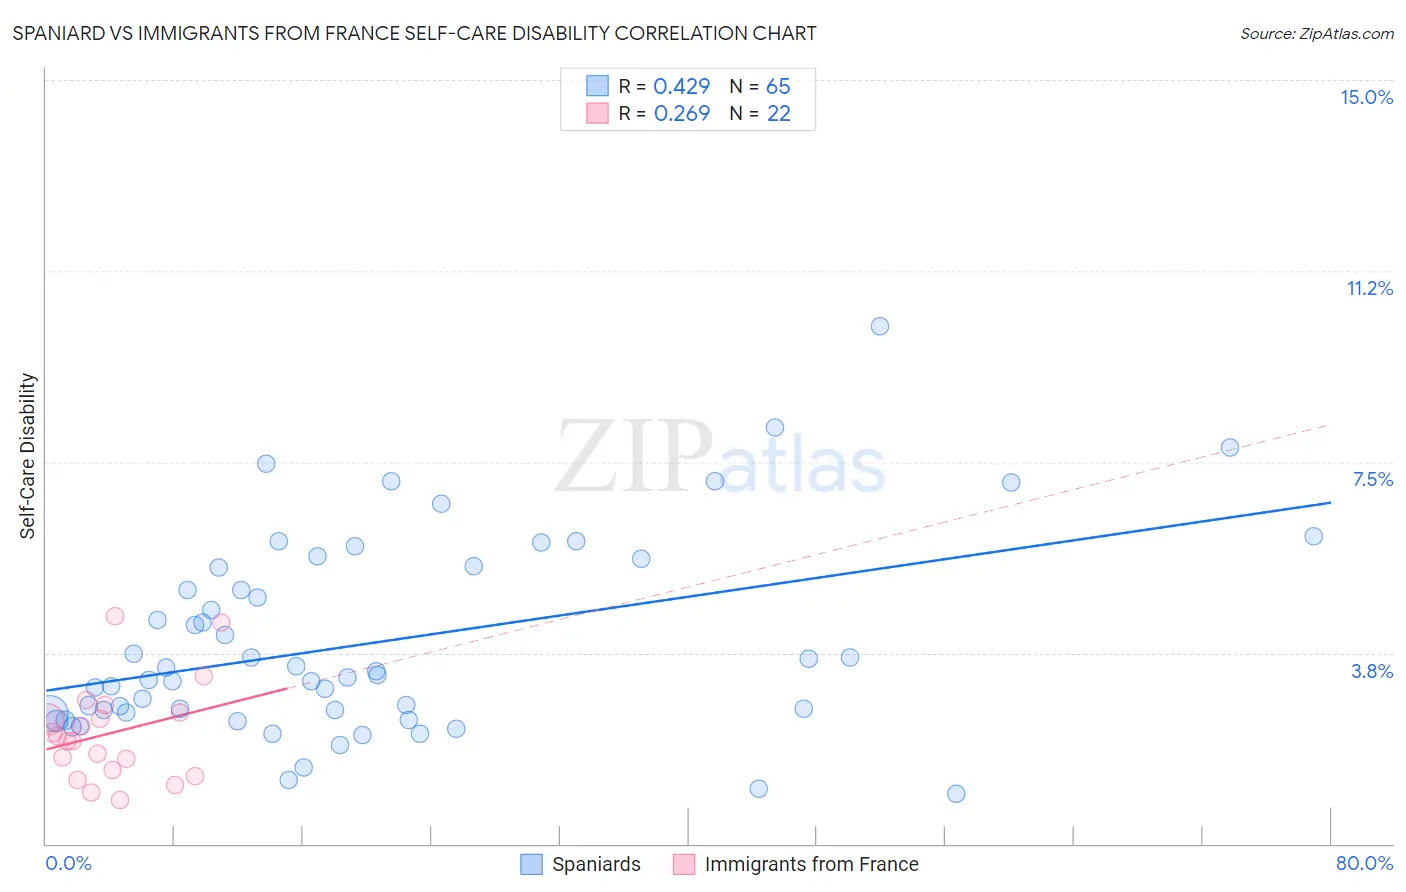
Spaniard vs Immigrants from France Self-Care Disability Correlation Chart
The statistical analysis conducted on geographies consisting of 442,715,832 people shows a moderate positive correlation between the proportion of Spaniards and percentage of population with self-care disability in the United States with a correlation coefficient (R) of 0.429 and weighted average of 2.6%. Similarly, the statistical analysis conducted on geographies consisting of 287,704,144 people shows a weak positive correlation between the proportion of Immigrants from France and percentage of population with self-care disability in the United States with a correlation coefficient (R) of 0.269 and weighted average of 2.3%, a difference of 11.2%.
Self-Care Disability Correlation Summary
| Measurement | Spaniard | Immigrants from France |
| Minimum | 0.97% | 0.85% |
| Maximum | 10.2% | 4.5% |
| Range | 9.2% | 3.6% |
| Mean | 3.9% | 2.2% |
| Median | 3.3% | 2.1% |
| Interquartile 25% (IQ1) | 2.6% | 1.4% |
| Interquartile 75% (IQ3) | 5.4% | 2.6% |
| Interquartile Range (IQR) | 2.9% | 1.1% |
| Standard Deviation (Sample) | 1.9% | 0.96% |
| Standard Deviation (Population) | 1.9% | 0.93% |
Similar Demographics by Self-Care Disability
Demographics Similar to Spaniards by Self-Care Disability
In terms of self-care disability, the demographic groups most similar to Spaniards are French Canadian (2.6%, a difference of 0.0%), Honduran (2.6%, a difference of 0.010%), Subsaharan African (2.6%, a difference of 0.050%), Immigrants from Moldova (2.6%, a difference of 0.060%), and Osage (2.6%, a difference of 0.060%).
| Demographics | Rating | Rank | Self-Care Disability |
| Immigrants | Thailand | 4.5 /100 | #215 | Tragic 2.6% |
| Whites/Caucasians | 4.4 /100 | #216 | Tragic 2.6% |
| Celtics | 4.4 /100 | #217 | Tragic 2.6% |
| Scotch-Irish | 4.1 /100 | #218 | Tragic 2.6% |
| Immigrants | Moldova | 4.0 /100 | #219 | Tragic 2.6% |
| Sub-Saharan Africans | 4.0 /100 | #220 | Tragic 2.6% |
| Hondurans | 3.8 /100 | #221 | Tragic 2.6% |
| Spaniards | 3.8 /100 | #222 | Tragic 2.6% |
| French Canadians | 3.8 /100 | #223 | Tragic 2.6% |
| Osage | 3.6 /100 | #224 | Tragic 2.6% |
| Iraqis | 3.2 /100 | #225 | Tragic 2.6% |
| Chinese | 2.9 /100 | #226 | Tragic 2.6% |
| Immigrants | Philippines | 2.7 /100 | #227 | Tragic 2.6% |
| Guatemalans | 2.7 /100 | #228 | Tragic 2.6% |
| Guamanians/Chamorros | 2.5 /100 | #229 | Tragic 2.6% |
Demographics Similar to Immigrants from France by Self-Care Disability
In terms of self-care disability, the demographic groups most similar to Immigrants from France are Immigrants from Eastern Asia (2.3%, a difference of 0.040%), Immigrants from Belgium (2.3%, a difference of 0.040%), Argentinean (2.3%, a difference of 0.060%), Australian (2.3%, a difference of 0.11%), and Immigrants from Cameroon (2.3%, a difference of 0.12%).
| Demographics | Rating | Rank | Self-Care Disability |
| Immigrants | Malaysia | 99.7 /100 | #48 | Exceptional 2.3% |
| Latvians | 99.7 /100 | #49 | Exceptional 2.3% |
| Immigrants | Brazil | 99.7 /100 | #50 | Exceptional 2.3% |
| Kenyans | 99.7 /100 | #51 | Exceptional 2.3% |
| Immigrants | Serbia | 99.6 /100 | #52 | Exceptional 2.3% |
| Australians | 99.6 /100 | #53 | Exceptional 2.3% |
| Argentineans | 99.6 /100 | #54 | Exceptional 2.3% |
| Immigrants | France | 99.6 /100 | #55 | Exceptional 2.3% |
| Immigrants | Eastern Asia | 99.6 /100 | #56 | Exceptional 2.3% |
| Immigrants | Belgium | 99.6 /100 | #57 | Exceptional 2.3% |
| Immigrants | Cameroon | 99.6 /100 | #58 | Exceptional 2.3% |
| New Zealanders | 99.5 /100 | #59 | Exceptional 2.3% |
| Immigrants | Japan | 99.5 /100 | #60 | Exceptional 2.3% |
| Palestinians | 99.4 /100 | #61 | Exceptional 2.3% |
| Egyptians | 99.4 /100 | #62 | Exceptional 2.3% |