Iranian vs Immigrants from Canada Self-Care Disability
COMPARE
Iranian
Immigrants from Canada
Self-Care Disability
Self-Care Disability Comparison
Iranians
Immigrants from Canada
2.3%
SELF-CARE DISABILITY
99.8/ 100
METRIC RATING
40th/ 347
METRIC RANK
2.4%
SELF-CARE DISABILITY
92.0/ 100
METRIC RATING
118th/ 347
METRIC RANK
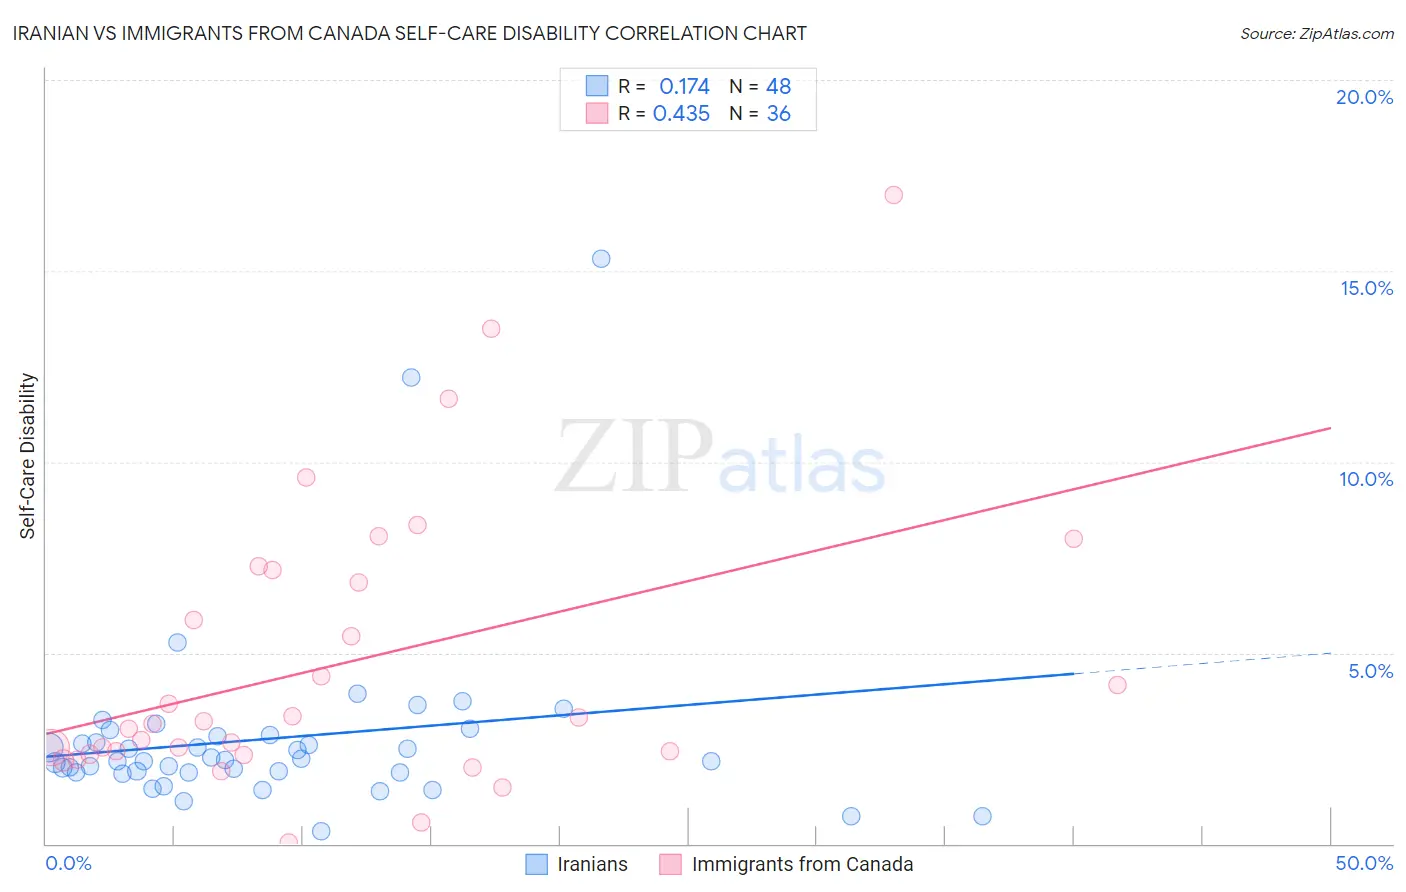
Iranian vs Immigrants from Canada Self-Care Disability Correlation Chart
The statistical analysis conducted on geographies consisting of 316,529,942 people shows a poor positive correlation between the proportion of Iranians and percentage of population with self-care disability in the United States with a correlation coefficient (R) of 0.174 and weighted average of 2.3%. Similarly, the statistical analysis conducted on geographies consisting of 458,661,407 people shows a moderate positive correlation between the proportion of Immigrants from Canada and percentage of population with self-care disability in the United States with a correlation coefficient (R) of 0.435 and weighted average of 2.4%, a difference of 5.1%.
Self-Care Disability Correlation Summary
| Measurement | Iranian | Immigrants from Canada |
| Minimum | 0.34% | 0.045% |
| Maximum | 15.3% | 17.0% |
| Range | 15.0% | 17.0% |
| Mean | 2.8% | 4.7% |
| Median | 2.2% | 3.2% |
| Interquartile 25% (IQ1) | 1.9% | 2.4% |
| Interquartile 75% (IQ3) | 2.8% | 7.0% |
| Interquartile Range (IQR) | 0.97% | 4.6% |
| Standard Deviation (Sample) | 2.5% | 3.7% |
| Standard Deviation (Population) | 2.5% | 3.7% |
Similar Demographics by Self-Care Disability
Demographics Similar to Iranians by Self-Care Disability
In terms of self-care disability, the demographic groups most similar to Iranians are Immigrants from Bulgaria (2.3%, a difference of 0.040%), Immigrants from Sudan (2.3%, a difference of 0.070%), Immigrants from Eastern Africa (2.3%, a difference of 0.15%), Immigrants from Uganda (2.3%, a difference of 0.17%), and Immigrants from Pakistan (2.3%, a difference of 0.21%).
| Demographics | Rating | Rank | Self-Care Disability |
| Immigrants | Korea | 99.9 /100 | #33 | Exceptional 2.3% |
| Immigrants | Turkey | 99.9 /100 | #34 | Exceptional 2.3% |
| Immigrants | Australia | 99.9 /100 | #35 | Exceptional 2.3% |
| Immigrants | Lithuania | 99.9 /100 | #36 | Exceptional 2.3% |
| Immigrants | Sweden | 99.9 /100 | #37 | Exceptional 2.3% |
| Immigrants | Eastern Africa | 99.9 /100 | #38 | Exceptional 2.3% |
| Immigrants | Bulgaria | 99.8 /100 | #39 | Exceptional 2.3% |
| Iranians | 99.8 /100 | #40 | Exceptional 2.3% |
| Immigrants | Sudan | 99.8 /100 | #41 | Exceptional 2.3% |
| Immigrants | Uganda | 99.8 /100 | #42 | Exceptional 2.3% |
| Immigrants | Pakistan | 99.8 /100 | #43 | Exceptional 2.3% |
| Immigrants | South Africa | 99.8 /100 | #44 | Exceptional 2.3% |
| Norwegians | 99.8 /100 | #45 | Exceptional 2.3% |
| Czechs | 99.8 /100 | #46 | Exceptional 2.3% |
| Jordanians | 99.7 /100 | #47 | Exceptional 2.3% |
Demographics Similar to Immigrants from Canada by Self-Care Disability
In terms of self-care disability, the demographic groups most similar to Immigrants from Canada are Immigrants from Sierra Leone (2.4%, a difference of 0.030%), Uruguayan (2.4%, a difference of 0.080%), Taiwanese (2.4%, a difference of 0.090%), Peruvian (2.4%, a difference of 0.11%), and Northern European (2.4%, a difference of 0.15%).
| Demographics | Rating | Rank | Self-Care Disability |
| Serbians | 93.6 /100 | #111 | Exceptional 2.4% |
| Scandinavians | 93.5 /100 | #112 | Exceptional 2.4% |
| South Americans | 93.2 /100 | #113 | Exceptional 2.4% |
| Immigrants | North Macedonia | 93.1 /100 | #114 | Exceptional 2.4% |
| Immigrants | Hong Kong | 93.1 /100 | #115 | Exceptional 2.4% |
| Northern Europeans | 92.9 /100 | #116 | Exceptional 2.4% |
| Taiwanese | 92.5 /100 | #117 | Exceptional 2.4% |
| Immigrants | Canada | 92.0 /100 | #118 | Exceptional 2.4% |
| Immigrants | Sierra Leone | 91.8 /100 | #119 | Exceptional 2.4% |
| Uruguayans | 91.5 /100 | #120 | Exceptional 2.4% |
| Peruvians | 91.3 /100 | #121 | Exceptional 2.4% |
| Belgians | 90.9 /100 | #122 | Exceptional 2.4% |
| Immigrants | Nigeria | 90.3 /100 | #123 | Exceptional 2.4% |
| Immigrants | North America | 90.2 /100 | #124 | Exceptional 2.4% |
| Immigrants | Morocco | 90.2 /100 | #124 | Exceptional 2.4% |