Spaniard vs Russian Self-Care Disability
COMPARE
Spaniard
Russian
Self-Care Disability
Self-Care Disability Comparison
Spaniards
Russians
2.6%
SELF-CARE DISABILITY
3.8/ 100
METRIC RATING
222nd/ 347
METRIC RANK
2.4%
SELF-CARE DISABILITY
88.2/ 100
METRIC RATING
134th/ 347
METRIC RANK
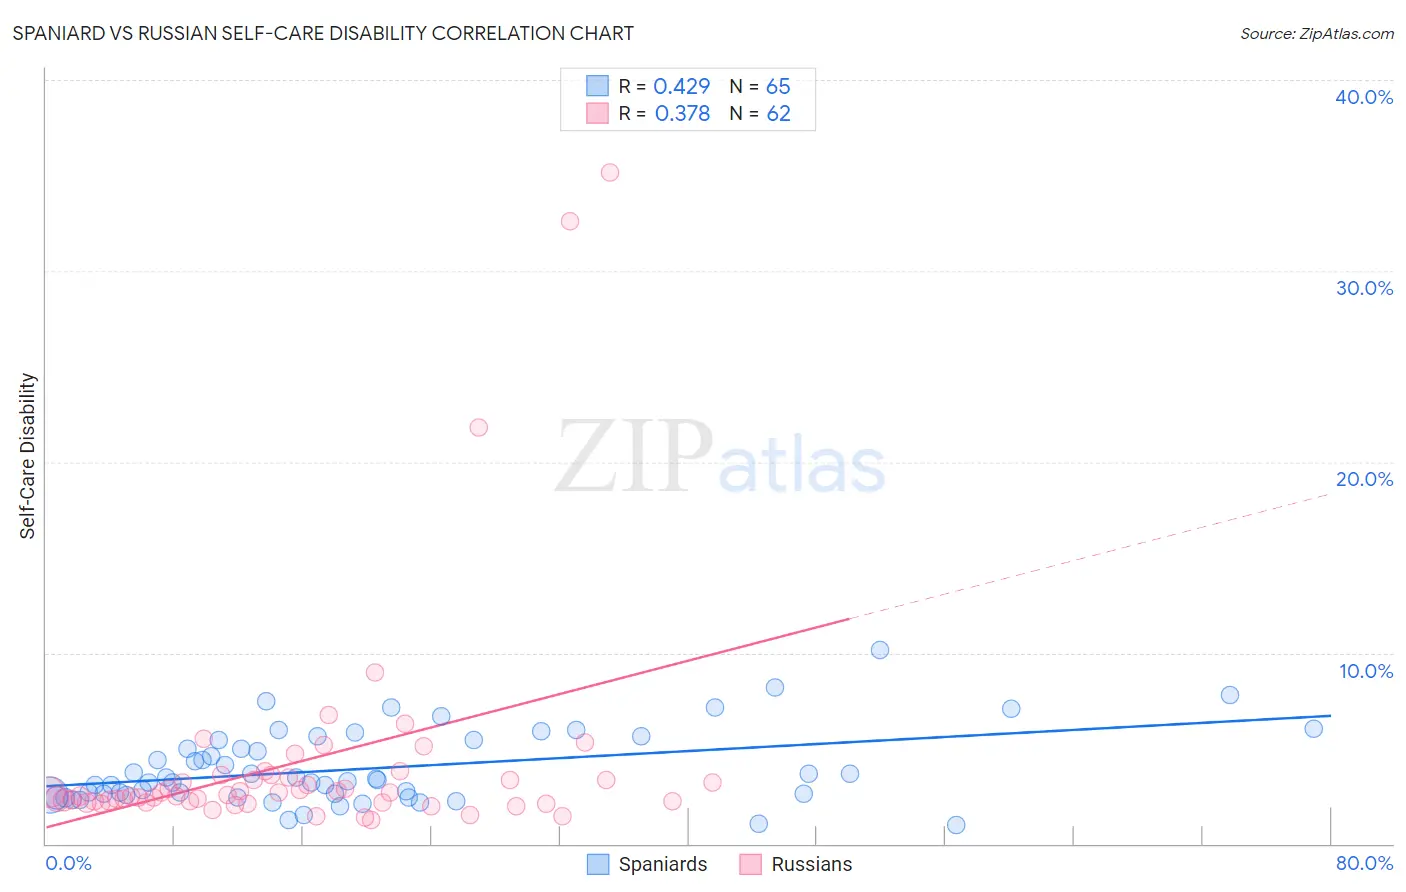
Spaniard vs Russian Self-Care Disability Correlation Chart
The statistical analysis conducted on geographies consisting of 442,715,832 people shows a moderate positive correlation between the proportion of Spaniards and percentage of population with self-care disability in the United States with a correlation coefficient (R) of 0.429 and weighted average of 2.6%. Similarly, the statistical analysis conducted on geographies consisting of 510,848,138 people shows a mild positive correlation between the proportion of Russians and percentage of population with self-care disability in the United States with a correlation coefficient (R) of 0.378 and weighted average of 2.4%, a difference of 6.4%.
Self-Care Disability Correlation Summary
| Measurement | Spaniard | Russian |
| Minimum | 0.97% | 1.2% |
| Maximum | 10.2% | 35.1% |
| Range | 9.2% | 33.9% |
| Mean | 3.9% | 4.3% |
| Median | 3.3% | 2.6% |
| Interquartile 25% (IQ1) | 2.6% | 2.2% |
| Interquartile 75% (IQ3) | 5.4% | 3.4% |
| Interquartile Range (IQR) | 2.9% | 1.2% |
| Standard Deviation (Sample) | 1.9% | 6.1% |
| Standard Deviation (Population) | 1.9% | 6.1% |
Similar Demographics by Self-Care Disability
Demographics Similar to Spaniards by Self-Care Disability
In terms of self-care disability, the demographic groups most similar to Spaniards are French Canadian (2.6%, a difference of 0.0%), Honduran (2.6%, a difference of 0.010%), Subsaharan African (2.6%, a difference of 0.050%), Immigrants from Moldova (2.6%, a difference of 0.060%), and Osage (2.6%, a difference of 0.060%).
| Demographics | Rating | Rank | Self-Care Disability |
| Immigrants | Thailand | 4.5 /100 | #215 | Tragic 2.6% |
| Whites/Caucasians | 4.4 /100 | #216 | Tragic 2.6% |
| Celtics | 4.4 /100 | #217 | Tragic 2.6% |
| Scotch-Irish | 4.1 /100 | #218 | Tragic 2.6% |
| Immigrants | Moldova | 4.0 /100 | #219 | Tragic 2.6% |
| Sub-Saharan Africans | 4.0 /100 | #220 | Tragic 2.6% |
| Hondurans | 3.8 /100 | #221 | Tragic 2.6% |
| Spaniards | 3.8 /100 | #222 | Tragic 2.6% |
| French Canadians | 3.8 /100 | #223 | Tragic 2.6% |
| Osage | 3.6 /100 | #224 | Tragic 2.6% |
| Iraqis | 3.2 /100 | #225 | Tragic 2.6% |
| Chinese | 2.9 /100 | #226 | Tragic 2.6% |
| Immigrants | Philippines | 2.7 /100 | #227 | Tragic 2.6% |
| Guatemalans | 2.7 /100 | #228 | Tragic 2.6% |
| Guamanians/Chamorros | 2.5 /100 | #229 | Tragic 2.6% |
Demographics Similar to Russians by Self-Care Disability
In terms of self-care disability, the demographic groups most similar to Russians are Immigrants from Colombia (2.4%, a difference of 0.040%), Laotian (2.4%, a difference of 0.050%), Immigrants from South America (2.4%, a difference of 0.070%), Polish (2.4%, a difference of 0.080%), and Immigrants from Austria (2.4%, a difference of 0.10%).
| Demographics | Rating | Rank | Self-Care Disability |
| Colombians | 89.7 /100 | #127 | Excellent 2.4% |
| Immigrants | Hungary | 89.6 /100 | #128 | Excellent 2.4% |
| Immigrants | Romania | 89.3 /100 | #129 | Excellent 2.4% |
| Immigrants | Austria | 89.0 /100 | #130 | Excellent 2.4% |
| Poles | 88.9 /100 | #131 | Excellent 2.4% |
| Immigrants | South America | 88.8 /100 | #132 | Excellent 2.4% |
| Immigrants | Colombia | 88.5 /100 | #133 | Excellent 2.4% |
| Russians | 88.2 /100 | #134 | Excellent 2.4% |
| Laotians | 87.8 /100 | #135 | Excellent 2.4% |
| South American Indians | 87.2 /100 | #136 | Excellent 2.4% |
| Austrians | 87.0 /100 | #137 | Excellent 2.4% |
| Immigrants | Croatia | 86.6 /100 | #138 | Excellent 2.4% |
| Sri Lankans | 86.6 /100 | #139 | Excellent 2.4% |
| Immigrants | Uruguay | 85.4 /100 | #140 | Excellent 2.4% |
| Alaska Natives | 84.5 /100 | #141 | Excellent 2.4% |