Spaniard vs Belizean Self-Care Disability
COMPARE
Spaniard
Belizean
Self-Care Disability
Self-Care Disability Comparison
Spaniards
Belizeans
2.6%
SELF-CARE DISABILITY
3.8/ 100
METRIC RATING
222nd/ 347
METRIC RANK
2.7%
SELF-CARE DISABILITY
0.0/ 100
METRIC RATING
293rd/ 347
METRIC RANK
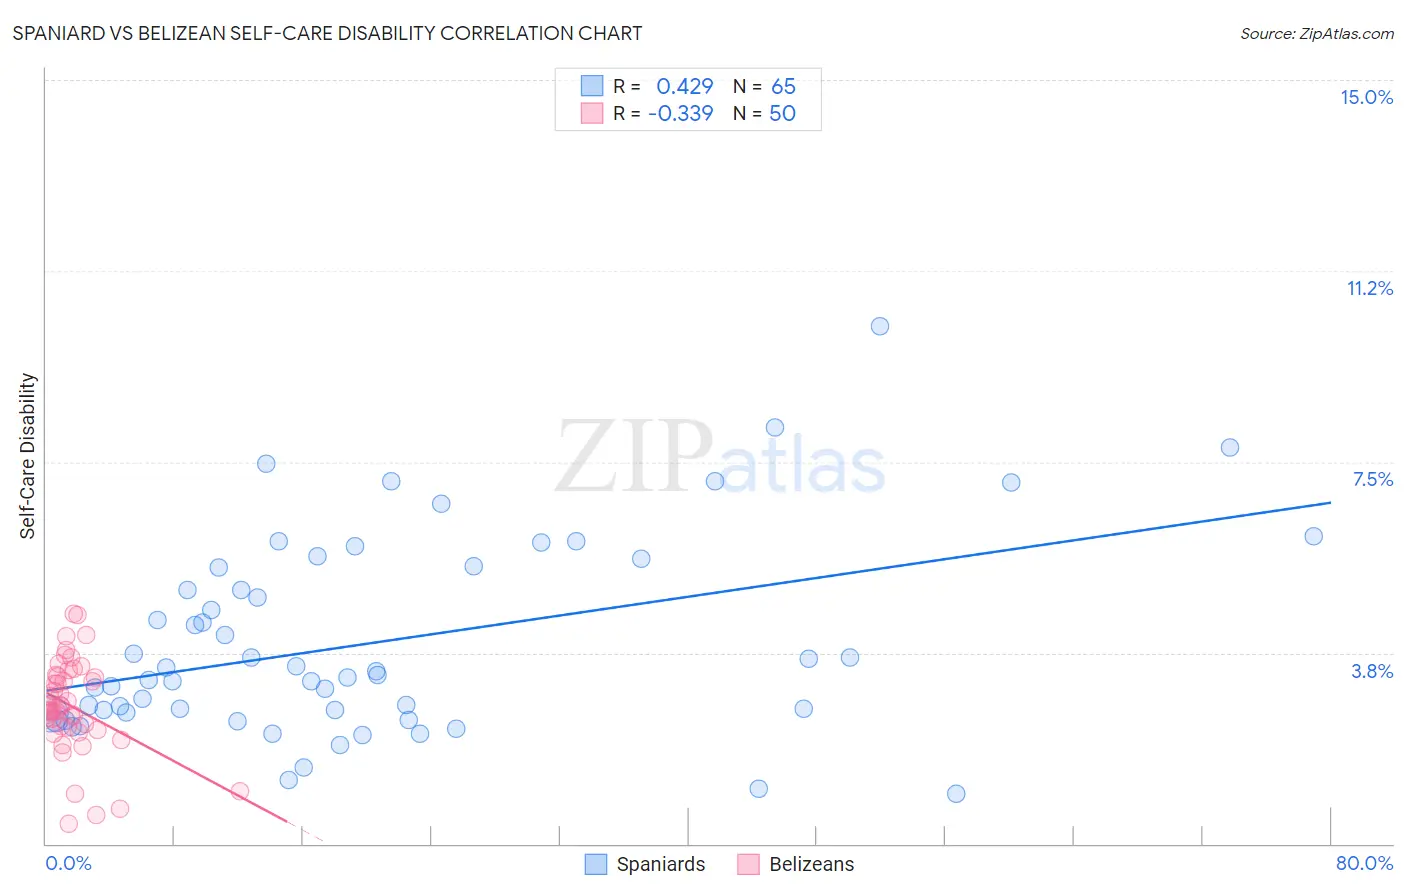
Spaniard vs Belizean Self-Care Disability Correlation Chart
The statistical analysis conducted on geographies consisting of 442,715,832 people shows a moderate positive correlation between the proportion of Spaniards and percentage of population with self-care disability in the United States with a correlation coefficient (R) of 0.429 and weighted average of 2.6%. Similarly, the statistical analysis conducted on geographies consisting of 144,103,033 people shows a mild negative correlation between the proportion of Belizeans and percentage of population with self-care disability in the United States with a correlation coefficient (R) of -0.339 and weighted average of 2.7%, a difference of 7.0%.
Self-Care Disability Correlation Summary
| Measurement | Spaniard | Belizean |
| Minimum | 0.97% | 0.38% |
| Maximum | 10.2% | 4.5% |
| Range | 9.2% | 4.1% |
| Mean | 3.9% | 2.7% |
| Median | 3.3% | 2.7% |
| Interquartile 25% (IQ1) | 2.6% | 2.3% |
| Interquartile 75% (IQ3) | 5.4% | 3.3% |
| Interquartile Range (IQR) | 2.9% | 1.0% |
| Standard Deviation (Sample) | 1.9% | 0.92% |
| Standard Deviation (Population) | 1.9% | 0.91% |
Similar Demographics by Self-Care Disability
Demographics Similar to Spaniards by Self-Care Disability
In terms of self-care disability, the demographic groups most similar to Spaniards are French Canadian (2.6%, a difference of 0.0%), Honduran (2.6%, a difference of 0.010%), Subsaharan African (2.6%, a difference of 0.050%), Immigrants from Moldova (2.6%, a difference of 0.060%), and Osage (2.6%, a difference of 0.060%).
| Demographics | Rating | Rank | Self-Care Disability |
| Immigrants | Thailand | 4.5 /100 | #215 | Tragic 2.6% |
| Whites/Caucasians | 4.4 /100 | #216 | Tragic 2.6% |
| Celtics | 4.4 /100 | #217 | Tragic 2.6% |
| Scotch-Irish | 4.1 /100 | #218 | Tragic 2.6% |
| Immigrants | Moldova | 4.0 /100 | #219 | Tragic 2.6% |
| Sub-Saharan Africans | 4.0 /100 | #220 | Tragic 2.6% |
| Hondurans | 3.8 /100 | #221 | Tragic 2.6% |
| Spaniards | 3.8 /100 | #222 | Tragic 2.6% |
| French Canadians | 3.8 /100 | #223 | Tragic 2.6% |
| Osage | 3.6 /100 | #224 | Tragic 2.6% |
| Iraqis | 3.2 /100 | #225 | Tragic 2.6% |
| Chinese | 2.9 /100 | #226 | Tragic 2.6% |
| Immigrants | Philippines | 2.7 /100 | #227 | Tragic 2.6% |
| Guatemalans | 2.7 /100 | #228 | Tragic 2.6% |
| Guamanians/Chamorros | 2.5 /100 | #229 | Tragic 2.6% |
Demographics Similar to Belizeans by Self-Care Disability
In terms of self-care disability, the demographic groups most similar to Belizeans are Central American Indian (2.7%, a difference of 0.0%), Blackfeet (2.7%, a difference of 0.010%), Barbadian (2.7%, a difference of 0.15%), Guyanese (2.7%, a difference of 0.16%), and Cuban (2.7%, a difference of 0.42%).
| Demographics | Rating | Rank | Self-Care Disability |
| French American Indians | 0.0 /100 | #286 | Tragic 2.7% |
| Immigrants | Jamaica | 0.0 /100 | #287 | Tragic 2.7% |
| Immigrants | Barbados | 0.0 /100 | #288 | Tragic 2.7% |
| Africans | 0.0 /100 | #289 | Tragic 2.7% |
| Cubans | 0.0 /100 | #290 | Tragic 2.7% |
| Guyanese | 0.0 /100 | #291 | Tragic 2.7% |
| Central American Indians | 0.0 /100 | #292 | Tragic 2.7% |
| Belizeans | 0.0 /100 | #293 | Tragic 2.7% |
| Blackfeet | 0.0 /100 | #294 | Tragic 2.7% |
| Barbadians | 0.0 /100 | #295 | Tragic 2.7% |
| Immigrants | Portugal | 0.0 /100 | #296 | Tragic 2.8% |
| West Indians | 0.0 /100 | #297 | Tragic 2.8% |
| Americans | 0.0 /100 | #298 | Tragic 2.8% |
| Immigrants | Guyana | 0.0 /100 | #299 | Tragic 2.8% |
| Immigrants | Fiji | 0.0 /100 | #300 | Tragic 2.8% |