Spaniard vs Immigrants from Canada In Labor Force | Age 20-24
COMPARE
Spaniard
Immigrants from Canada
In Labor Force | Age 20-24
In Labor Force | Age 20-24 Comparison
Spaniards
Immigrants from Canada
75.5%
IN LABOR FORCE | AGE 20-24
82.0/ 100
METRIC RATING
143rd/ 347
METRIC RANK
75.9%
IN LABOR FORCE | AGE 20-24
95.6/ 100
METRIC RATING
112th/ 347
METRIC RANK
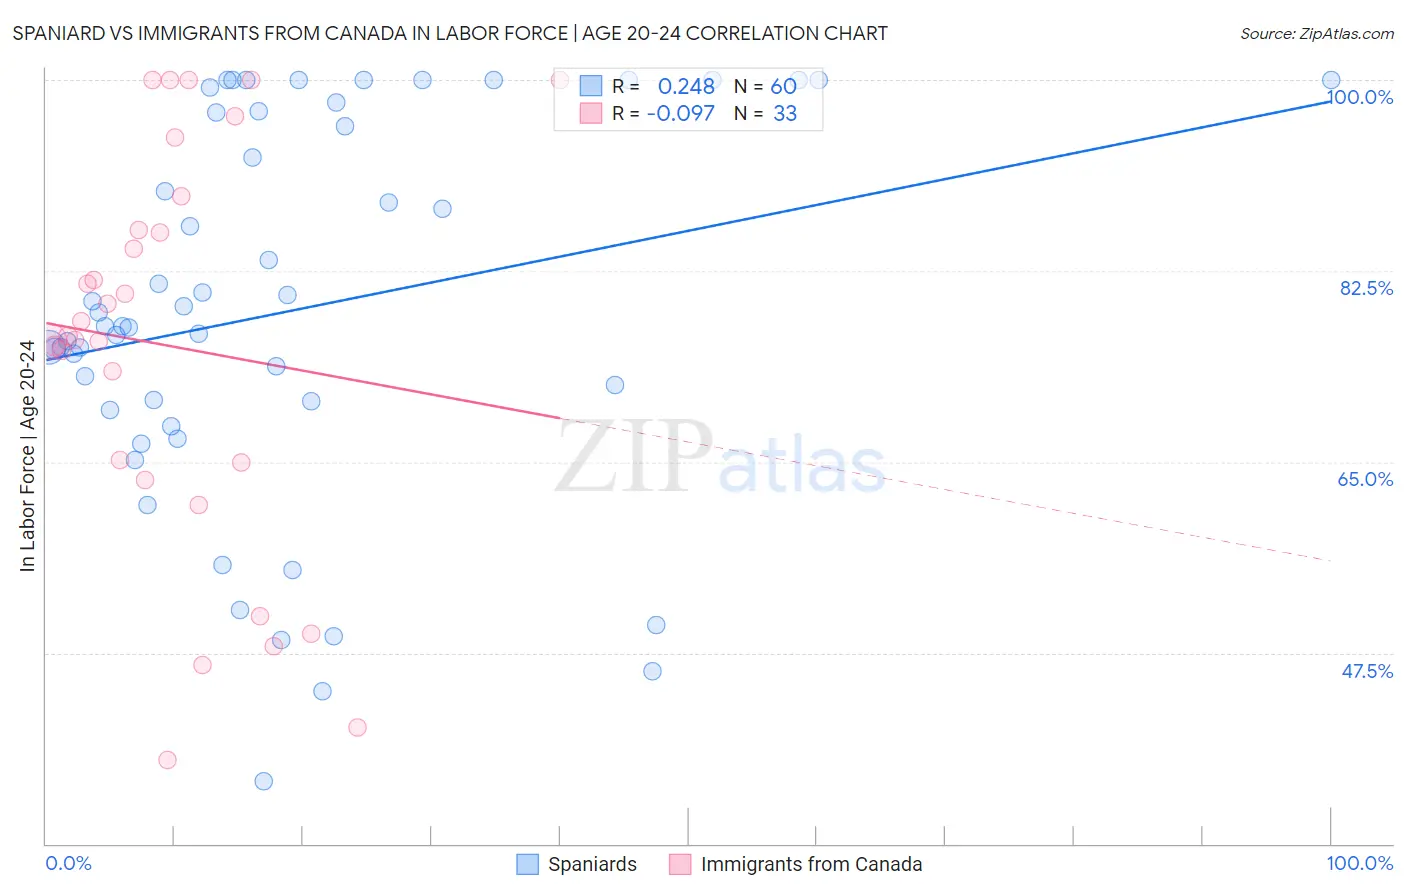
Spaniard vs Immigrants from Canada In Labor Force | Age 20-24 Correlation Chart
The statistical analysis conducted on geographies consisting of 443,259,827 people shows a weak positive correlation between the proportion of Spaniards and labor force participation rate among population between the ages 20 and 24 in the United States with a correlation coefficient (R) of 0.248 and weighted average of 75.5%. Similarly, the statistical analysis conducted on geographies consisting of 458,968,700 people shows a slight negative correlation between the proportion of Immigrants from Canada and labor force participation rate among population between the ages 20 and 24 in the United States with a correlation coefficient (R) of -0.097 and weighted average of 75.9%, a difference of 0.57%.
In Labor Force | Age 20-24 Correlation Summary
| Measurement | Spaniard | Immigrants from Canada |
| Minimum | 35.7% | 37.7% |
| Maximum | 100.0% | 100.0% |
| Range | 64.3% | 62.3% |
| Mean | 78.8% | 75.6% |
| Median | 77.4% | 76.5% |
| Interquartile 25% (IQ1) | 70.2% | 64.1% |
| Interquartile 75% (IQ3) | 97.1% | 87.8% |
| Interquartile Range (IQR) | 26.9% | 23.6% |
| Standard Deviation (Sample) | 17.3% | 18.2% |
| Standard Deviation (Population) | 17.2% | 17.9% |
Similar Demographics by In Labor Force | Age 20-24
Demographics Similar to Spaniards by In Labor Force | Age 20-24
In terms of in labor force | age 20-24, the demographic groups most similar to Spaniards are Bhutanese (75.4%, a difference of 0.030%), Blackfeet (75.5%, a difference of 0.040%), Romanian (75.5%, a difference of 0.050%), Korean (75.4%, a difference of 0.050%), and Immigrants from Brazil (75.5%, a difference of 0.070%).
| Demographics | Rating | Rank | In Labor Force | Age 20-24 |
| Immigrants | Brazil | 84.8 /100 | #136 | Excellent 75.5% |
| Jordanians | 84.8 /100 | #137 | Excellent 75.5% |
| Australians | 84.8 /100 | #138 | Excellent 75.5% |
| Immigrants | England | 84.6 /100 | #139 | Excellent 75.5% |
| Delaware | 84.5 /100 | #140 | Excellent 75.5% |
| Romanians | 84.1 /100 | #141 | Excellent 75.5% |
| Blackfeet | 83.6 /100 | #142 | Excellent 75.5% |
| Spaniards | 82.0 /100 | #143 | Excellent 75.5% |
| Bhutanese | 80.8 /100 | #144 | Excellent 75.4% |
| Koreans | 79.7 /100 | #145 | Good 75.4% |
| Mexican American Indians | 78.8 /100 | #146 | Good 75.4% |
| Comanche | 77.6 /100 | #147 | Good 75.4% |
| Immigrants | Cambodia | 76.7 /100 | #148 | Good 75.4% |
| Ugandans | 76.1 /100 | #149 | Good 75.4% |
| Salvadorans | 74.8 /100 | #150 | Good 75.3% |
Demographics Similar to Immigrants from Canada by In Labor Force | Age 20-24
In terms of in labor force | age 20-24, the demographic groups most similar to Immigrants from Canada are Ukrainian (75.9%, a difference of 0.010%), Cherokee (75.9%, a difference of 0.020%), Immigrants from Morocco (75.9%, a difference of 0.020%), Immigrants from Netherlands (75.9%, a difference of 0.030%), and Immigrants from Zimbabwe (75.9%, a difference of 0.040%).
| Demographics | Rating | Rank | In Labor Force | Age 20-24 |
| Immigrants | Nepal | 97.2 /100 | #105 | Exceptional 76.0% |
| Immigrants | Uganda | 97.1 /100 | #106 | Exceptional 76.0% |
| Greeks | 96.9 /100 | #107 | Exceptional 76.0% |
| Iraqis | 96.6 /100 | #108 | Exceptional 76.0% |
| Cherokee | 95.8 /100 | #109 | Exceptional 75.9% |
| Immigrants | Morocco | 95.8 /100 | #110 | Exceptional 75.9% |
| Ukrainians | 95.7 /100 | #111 | Exceptional 75.9% |
| Immigrants | Canada | 95.6 /100 | #112 | Exceptional 75.9% |
| Immigrants | Netherlands | 95.3 /100 | #113 | Exceptional 75.9% |
| Immigrants | Zimbabwe | 95.1 /100 | #114 | Exceptional 75.9% |
| Alaska Natives | 95.1 /100 | #115 | Exceptional 75.9% |
| Immigrants | North America | 95.0 /100 | #116 | Exceptional 75.9% |
| Assyrians/Chaldeans/Syriacs | 94.9 /100 | #117 | Exceptional 75.9% |
| Spanish Americans | 94.8 /100 | #118 | Exceptional 75.8% |
| Immigrants | Portugal | 94.8 /100 | #119 | Exceptional 75.8% |