Somali vs Immigrants from Canada Self-Care Disability
COMPARE
Somali
Immigrants from Canada
Self-Care Disability
Self-Care Disability Comparison
Somalis
Immigrants from Canada
2.5%
SELF-CARE DISABILITY
63.7/ 100
METRIC RATING
162nd/ 347
METRIC RANK
2.4%
SELF-CARE DISABILITY
92.0/ 100
METRIC RATING
118th/ 347
METRIC RANK
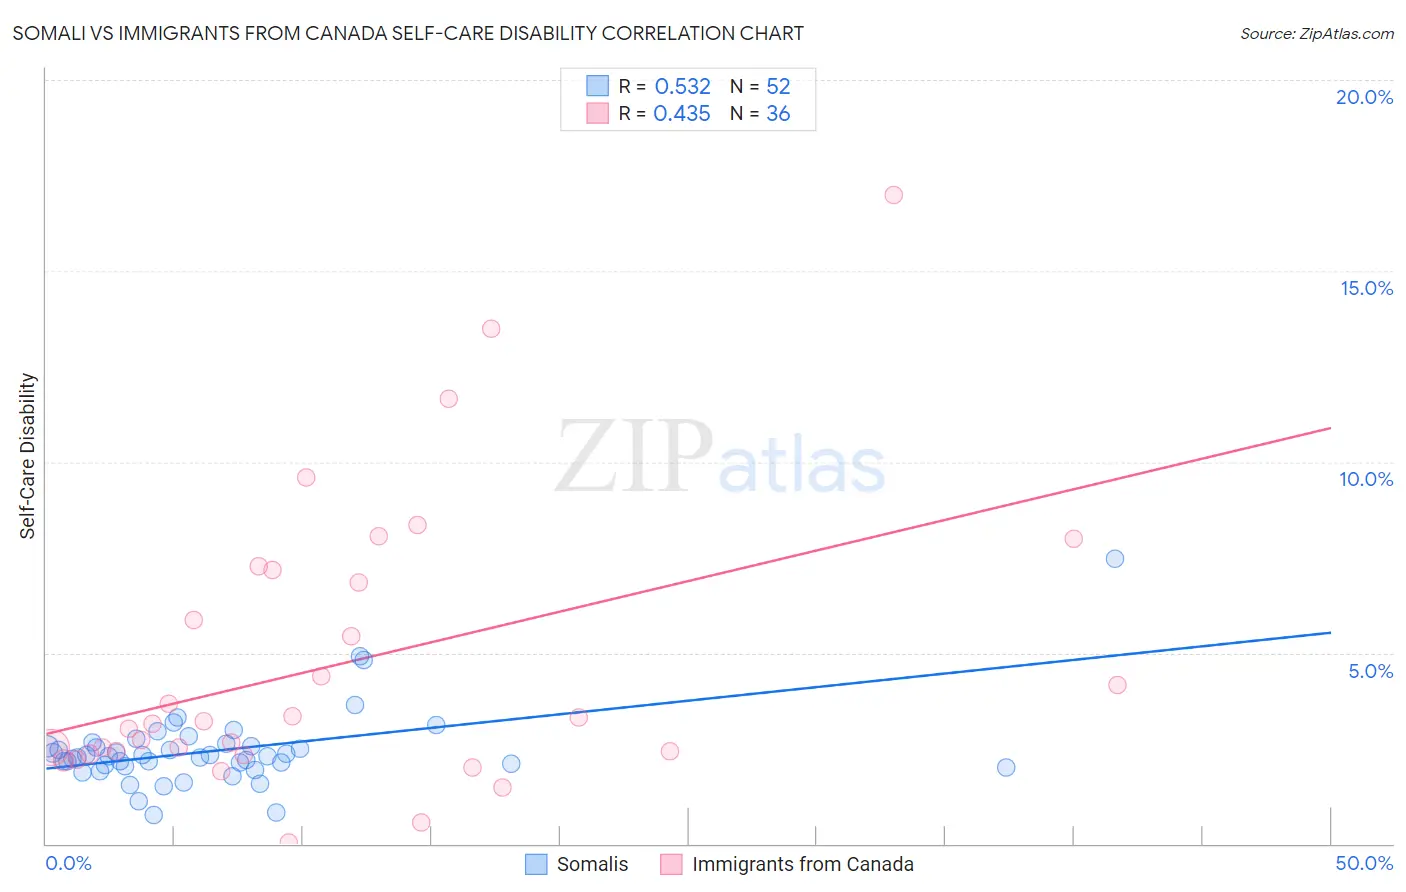
Somali vs Immigrants from Canada Self-Care Disability Correlation Chart
The statistical analysis conducted on geographies consisting of 99,258,512 people shows a substantial positive correlation between the proportion of Somalis and percentage of population with self-care disability in the United States with a correlation coefficient (R) of 0.532 and weighted average of 2.5%. Similarly, the statistical analysis conducted on geographies consisting of 458,661,407 people shows a moderate positive correlation between the proportion of Immigrants from Canada and percentage of population with self-care disability in the United States with a correlation coefficient (R) of 0.435 and weighted average of 2.4%, a difference of 2.3%.
Self-Care Disability Correlation Summary
| Measurement | Somali | Immigrants from Canada |
| Minimum | 0.74% | 0.045% |
| Maximum | 7.5% | 17.0% |
| Range | 6.7% | 17.0% |
| Mean | 2.4% | 4.7% |
| Median | 2.3% | 3.2% |
| Interquartile 25% (IQ1) | 2.0% | 2.4% |
| Interquartile 75% (IQ3) | 2.6% | 7.0% |
| Interquartile Range (IQR) | 0.54% | 4.6% |
| Standard Deviation (Sample) | 1.0% | 3.7% |
| Standard Deviation (Population) | 1.0% | 3.7% |
Similar Demographics by Self-Care Disability
Demographics Similar to Somalis by Self-Care Disability
In terms of self-care disability, the demographic groups most similar to Somalis are German Russian (2.5%, a difference of 0.050%), Lebanese (2.4%, a difference of 0.14%), Finnish (2.4%, a difference of 0.17%), Immigrants from Vietnam (2.5%, a difference of 0.23%), and Syrian (2.5%, a difference of 0.24%).
| Demographics | Rating | Rank | Self-Care Disability |
| Pakistanis | 71.4 /100 | #155 | Good 2.4% |
| Nigerians | 70.6 /100 | #156 | Good 2.4% |
| Immigrants | Europe | 69.6 /100 | #157 | Good 2.4% |
| Immigrants | Western Europe | 68.6 /100 | #158 | Good 2.4% |
| Immigrants | Italy | 68.5 /100 | #159 | Good 2.4% |
| Finns | 67.0 /100 | #160 | Good 2.4% |
| Lebanese | 66.5 /100 | #161 | Good 2.4% |
| Somalis | 63.7 /100 | #162 | Good 2.5% |
| German Russians | 62.7 /100 | #163 | Good 2.5% |
| Immigrants | Vietnam | 59.3 /100 | #164 | Average 2.5% |
| Syrians | 59.0 /100 | #165 | Average 2.5% |
| Canadians | 58.8 /100 | #166 | Average 2.5% |
| Immigrants | Greece | 57.3 /100 | #167 | Average 2.5% |
| Ute | 57.1 /100 | #168 | Average 2.5% |
| Immigrants | Somalia | 55.9 /100 | #169 | Average 2.5% |
Demographics Similar to Immigrants from Canada by Self-Care Disability
In terms of self-care disability, the demographic groups most similar to Immigrants from Canada are Immigrants from Sierra Leone (2.4%, a difference of 0.030%), Uruguayan (2.4%, a difference of 0.080%), Taiwanese (2.4%, a difference of 0.090%), Peruvian (2.4%, a difference of 0.11%), and Northern European (2.4%, a difference of 0.15%).
| Demographics | Rating | Rank | Self-Care Disability |
| Serbians | 93.6 /100 | #111 | Exceptional 2.4% |
| Scandinavians | 93.5 /100 | #112 | Exceptional 2.4% |
| South Americans | 93.2 /100 | #113 | Exceptional 2.4% |
| Immigrants | North Macedonia | 93.1 /100 | #114 | Exceptional 2.4% |
| Immigrants | Hong Kong | 93.1 /100 | #115 | Exceptional 2.4% |
| Northern Europeans | 92.9 /100 | #116 | Exceptional 2.4% |
| Taiwanese | 92.5 /100 | #117 | Exceptional 2.4% |
| Immigrants | Canada | 92.0 /100 | #118 | Exceptional 2.4% |
| Immigrants | Sierra Leone | 91.8 /100 | #119 | Exceptional 2.4% |
| Uruguayans | 91.5 /100 | #120 | Exceptional 2.4% |
| Peruvians | 91.3 /100 | #121 | Exceptional 2.4% |
| Belgians | 90.9 /100 | #122 | Exceptional 2.4% |
| Immigrants | Nigeria | 90.3 /100 | #123 | Exceptional 2.4% |
| Immigrants | North America | 90.2 /100 | #124 | Exceptional 2.4% |
| Immigrants | Morocco | 90.2 /100 | #124 | Exceptional 2.4% |