Japanese vs Immigrants from Canada Self-Care Disability
COMPARE
Japanese
Immigrants from Canada
Self-Care Disability
Self-Care Disability Comparison
Japanese
Immigrants from Canada
2.7%
SELF-CARE DISABILITY
0.1/ 100
METRIC RATING
276th/ 347
METRIC RANK
2.4%
SELF-CARE DISABILITY
92.0/ 100
METRIC RATING
118th/ 347
METRIC RANK
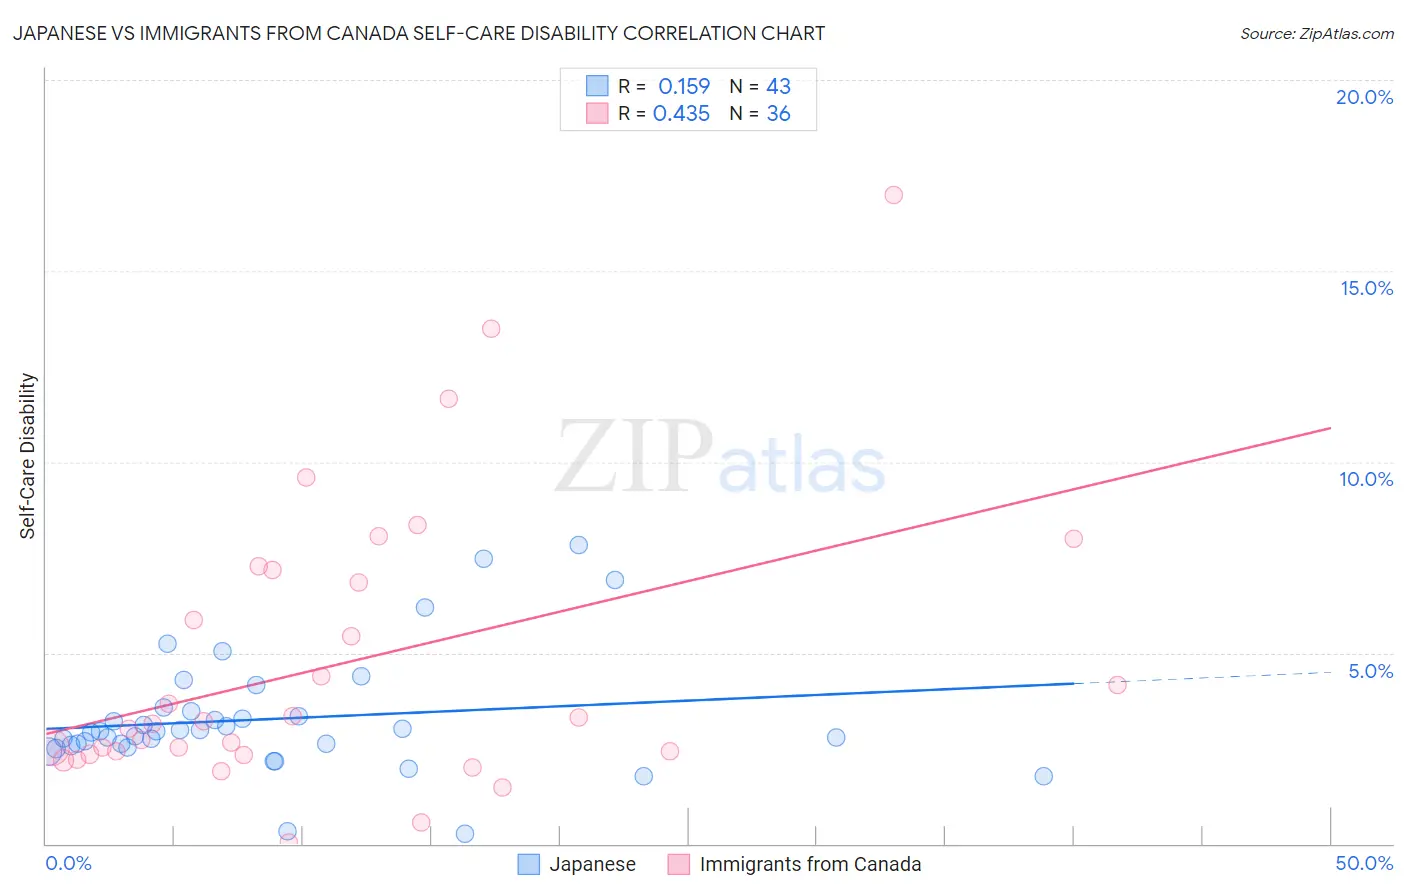
Japanese vs Immigrants from Canada Self-Care Disability Correlation Chart
The statistical analysis conducted on geographies consisting of 249,013,660 people shows a poor positive correlation between the proportion of Japanese and percentage of population with self-care disability in the United States with a correlation coefficient (R) of 0.159 and weighted average of 2.7%. Similarly, the statistical analysis conducted on geographies consisting of 458,661,407 people shows a moderate positive correlation between the proportion of Immigrants from Canada and percentage of population with self-care disability in the United States with a correlation coefficient (R) of 0.435 and weighted average of 2.4%, a difference of 12.0%.
Self-Care Disability Correlation Summary
| Measurement | Japanese | Immigrants from Canada |
| Minimum | 0.26% | 0.045% |
| Maximum | 7.8% | 17.0% |
| Range | 7.6% | 17.0% |
| Mean | 3.3% | 4.7% |
| Median | 2.9% | 3.2% |
| Interquartile 25% (IQ1) | 2.6% | 2.4% |
| Interquartile 75% (IQ3) | 3.5% | 7.0% |
| Interquartile Range (IQR) | 0.91% | 4.6% |
| Standard Deviation (Sample) | 1.6% | 3.7% |
| Standard Deviation (Population) | 1.5% | 3.7% |
Similar Demographics by Self-Care Disability
Demographics Similar to Japanese by Self-Care Disability
In terms of self-care disability, the demographic groups most similar to Japanese are Immigrants from Ukraine (2.7%, a difference of 0.060%), Yakama (2.7%, a difference of 0.13%), Immigrants from Trinidad and Tobago (2.7%, a difference of 0.13%), Ottawa (2.7%, a difference of 0.14%), and Mexican (2.7%, a difference of 0.19%).
| Demographics | Rating | Rank | Self-Care Disability |
| U.S. Virgin Islanders | 0.1 /100 | #269 | Tragic 2.7% |
| Immigrants | Micronesia | 0.1 /100 | #270 | Tragic 2.7% |
| Trinidadians and Tobagonians | 0.1 /100 | #271 | Tragic 2.7% |
| Immigrants | Laos | 0.1 /100 | #272 | Tragic 2.7% |
| Mexicans | 0.1 /100 | #273 | Tragic 2.7% |
| Yakama | 0.1 /100 | #274 | Tragic 2.7% |
| Immigrants | Trinidad and Tobago | 0.1 /100 | #275 | Tragic 2.7% |
| Japanese | 0.1 /100 | #276 | Tragic 2.7% |
| Immigrants | Ukraine | 0.1 /100 | #277 | Tragic 2.7% |
| Ottawa | 0.1 /100 | #278 | Tragic 2.7% |
| Iroquois | 0.1 /100 | #279 | Tragic 2.7% |
| Hispanics or Latinos | 0.1 /100 | #280 | Tragic 2.7% |
| Immigrants | Iraq | 0.0 /100 | #281 | Tragic 2.7% |
| Apache | 0.0 /100 | #282 | Tragic 2.7% |
| Delaware | 0.0 /100 | #283 | Tragic 2.7% |
Demographics Similar to Immigrants from Canada by Self-Care Disability
In terms of self-care disability, the demographic groups most similar to Immigrants from Canada are Immigrants from Sierra Leone (2.4%, a difference of 0.030%), Uruguayan (2.4%, a difference of 0.080%), Taiwanese (2.4%, a difference of 0.090%), Peruvian (2.4%, a difference of 0.11%), and Northern European (2.4%, a difference of 0.15%).
| Demographics | Rating | Rank | Self-Care Disability |
| Serbians | 93.6 /100 | #111 | Exceptional 2.4% |
| Scandinavians | 93.5 /100 | #112 | Exceptional 2.4% |
| South Americans | 93.2 /100 | #113 | Exceptional 2.4% |
| Immigrants | North Macedonia | 93.1 /100 | #114 | Exceptional 2.4% |
| Immigrants | Hong Kong | 93.1 /100 | #115 | Exceptional 2.4% |
| Northern Europeans | 92.9 /100 | #116 | Exceptional 2.4% |
| Taiwanese | 92.5 /100 | #117 | Exceptional 2.4% |
| Immigrants | Canada | 92.0 /100 | #118 | Exceptional 2.4% |
| Immigrants | Sierra Leone | 91.8 /100 | #119 | Exceptional 2.4% |
| Uruguayans | 91.5 /100 | #120 | Exceptional 2.4% |
| Peruvians | 91.3 /100 | #121 | Exceptional 2.4% |
| Belgians | 90.9 /100 | #122 | Exceptional 2.4% |
| Immigrants | Nigeria | 90.3 /100 | #123 | Exceptional 2.4% |
| Immigrants | North America | 90.2 /100 | #124 | Exceptional 2.4% |
| Immigrants | Morocco | 90.2 /100 | #124 | Exceptional 2.4% |