Sierra Leonean vs Chippewa Ambulatory Disability
COMPARE
Sierra Leonean
Chippewa
Ambulatory Disability
Ambulatory Disability Comparison
Sierra Leoneans
Chippewa
5.7%
AMBULATORY DISABILITY
99.4/ 100
METRIC RATING
70th/ 347
METRIC RANK
7.1%
AMBULATORY DISABILITY
0.0/ 100
METRIC RATING
308th/ 347
METRIC RANK
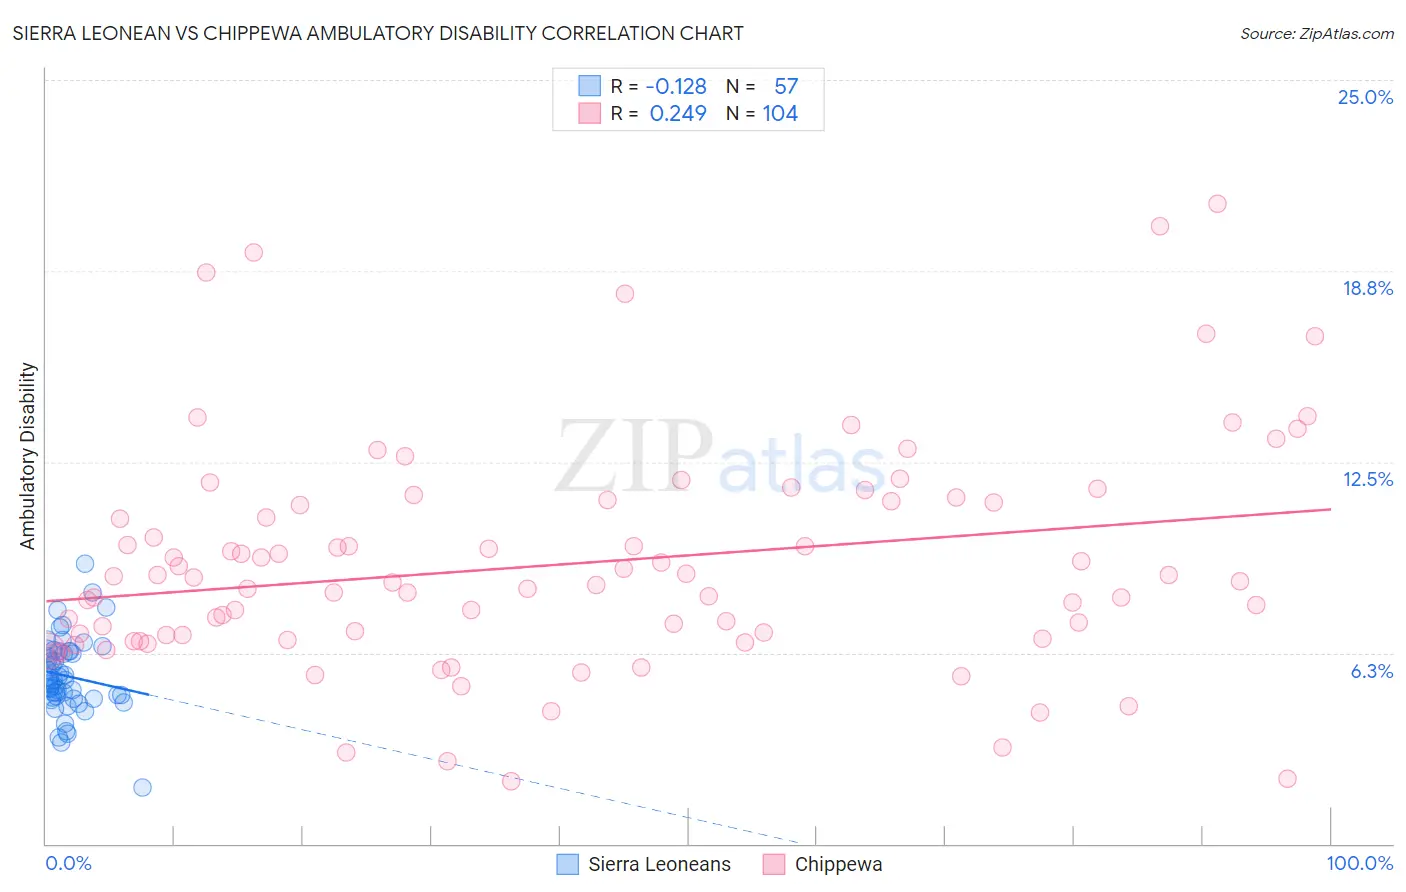
Sierra Leonean vs Chippewa Ambulatory Disability Correlation Chart
The statistical analysis conducted on geographies consisting of 83,336,135 people shows a poor negative correlation between the proportion of Sierra Leoneans and percentage of population with ambulatory disability in the United States with a correlation coefficient (R) of -0.128 and weighted average of 5.7%. Similarly, the statistical analysis conducted on geographies consisting of 215,009,829 people shows a weak positive correlation between the proportion of Chippewa and percentage of population with ambulatory disability in the United States with a correlation coefficient (R) of 0.249 and weighted average of 7.1%, a difference of 24.1%.
Ambulatory Disability Correlation Summary
| Measurement | Sierra Leonean | Chippewa |
| Minimum | 1.9% | 2.0% |
| Maximum | 9.1% | 20.9% |
| Range | 7.3% | 18.9% |
| Mean | 5.5% | 9.1% |
| Median | 5.4% | 8.6% |
| Interquartile 25% (IQ1) | 4.8% | 6.8% |
| Interquartile 75% (IQ3) | 6.3% | 11.2% |
| Interquartile Range (IQR) | 1.5% | 4.4% |
| Standard Deviation (Sample) | 1.3% | 3.7% |
| Standard Deviation (Population) | 1.2% | 3.7% |
Similar Demographics by Ambulatory Disability
Demographics Similar to Sierra Leoneans by Ambulatory Disability
In terms of ambulatory disability, the demographic groups most similar to Sierra Leoneans are Immigrants from Peru (5.7%, a difference of 0.090%), Brazilian (5.7%, a difference of 0.11%), Immigrants from Northern Africa (5.7%, a difference of 0.12%), Immigrants from Cameroon (5.7%, a difference of 0.13%), and Immigrants from South Africa (5.7%, a difference of 0.18%).
| Demographics | Rating | Rank | Ambulatory Disability |
| Immigrants | France | 99.7 /100 | #63 | Exceptional 5.6% |
| Laotians | 99.7 /100 | #64 | Exceptional 5.7% |
| Immigrants | Switzerland | 99.7 /100 | #65 | Exceptional 5.7% |
| Israelis | 99.6 /100 | #66 | Exceptional 5.7% |
| Immigrants | Uganda | 99.6 /100 | #67 | Exceptional 5.7% |
| Sri Lankans | 99.6 /100 | #68 | Exceptional 5.7% |
| Peruvians | 99.5 /100 | #69 | Exceptional 5.7% |
| Sierra Leoneans | 99.4 /100 | #70 | Exceptional 5.7% |
| Immigrants | Peru | 99.4 /100 | #71 | Exceptional 5.7% |
| Brazilians | 99.4 /100 | #72 | Exceptional 5.7% |
| Immigrants | Northern Africa | 99.4 /100 | #73 | Exceptional 5.7% |
| Immigrants | Cameroon | 99.4 /100 | #74 | Exceptional 5.7% |
| Immigrants | South Africa | 99.3 /100 | #75 | Exceptional 5.7% |
| Sudanese | 99.3 /100 | #76 | Exceptional 5.7% |
| Immigrants | Vietnam | 99.3 /100 | #77 | Exceptional 5.7% |
Demographics Similar to Chippewa by Ambulatory Disability
In terms of ambulatory disability, the demographic groups most similar to Chippewa are Spanish American (7.1%, a difference of 0.0%), Immigrants from the Azores (7.1%, a difference of 0.17%), Iroquois (7.1%, a difference of 0.27%), Arapaho (7.1%, a difference of 0.45%), and Cree (7.1%, a difference of 0.46%).
| Demographics | Rating | Rank | Ambulatory Disability |
| British West Indians | 0.0 /100 | #301 | Tragic 7.0% |
| Immigrants | Armenia | 0.0 /100 | #302 | Tragic 7.0% |
| Africans | 0.0 /100 | #303 | Tragic 7.0% |
| Immigrants | Cabo Verde | 0.0 /100 | #304 | Tragic 7.0% |
| Immigrants | Micronesia | 0.0 /100 | #305 | Tragic 7.0% |
| Iroquois | 0.0 /100 | #306 | Tragic 7.1% |
| Spanish Americans | 0.0 /100 | #307 | Tragic 7.1% |
| Chippewa | 0.0 /100 | #308 | Tragic 7.1% |
| Immigrants | Azores | 0.0 /100 | #309 | Tragic 7.1% |
| Arapaho | 0.0 /100 | #310 | Tragic 7.1% |
| Cree | 0.0 /100 | #311 | Tragic 7.1% |
| Delaware | 0.0 /100 | #312 | Tragic 7.1% |
| Immigrants | Yemen | 0.0 /100 | #313 | Tragic 7.1% |
| Blackfeet | 0.0 /100 | #314 | Tragic 7.1% |
| Shoshone | 0.0 /100 | #315 | Tragic 7.1% |