Sierra Leonean vs Immigrants from Lithuania Ambulatory Disability
COMPARE
Sierra Leonean
Immigrants from Lithuania
Ambulatory Disability
Ambulatory Disability Comparison
Sierra Leoneans
Immigrants from Lithuania
5.7%
AMBULATORY DISABILITY
99.4/ 100
METRIC RATING
70th/ 347
METRIC RANK
5.6%
AMBULATORY DISABILITY
99.8/ 100
METRIC RATING
60th/ 347
METRIC RANK
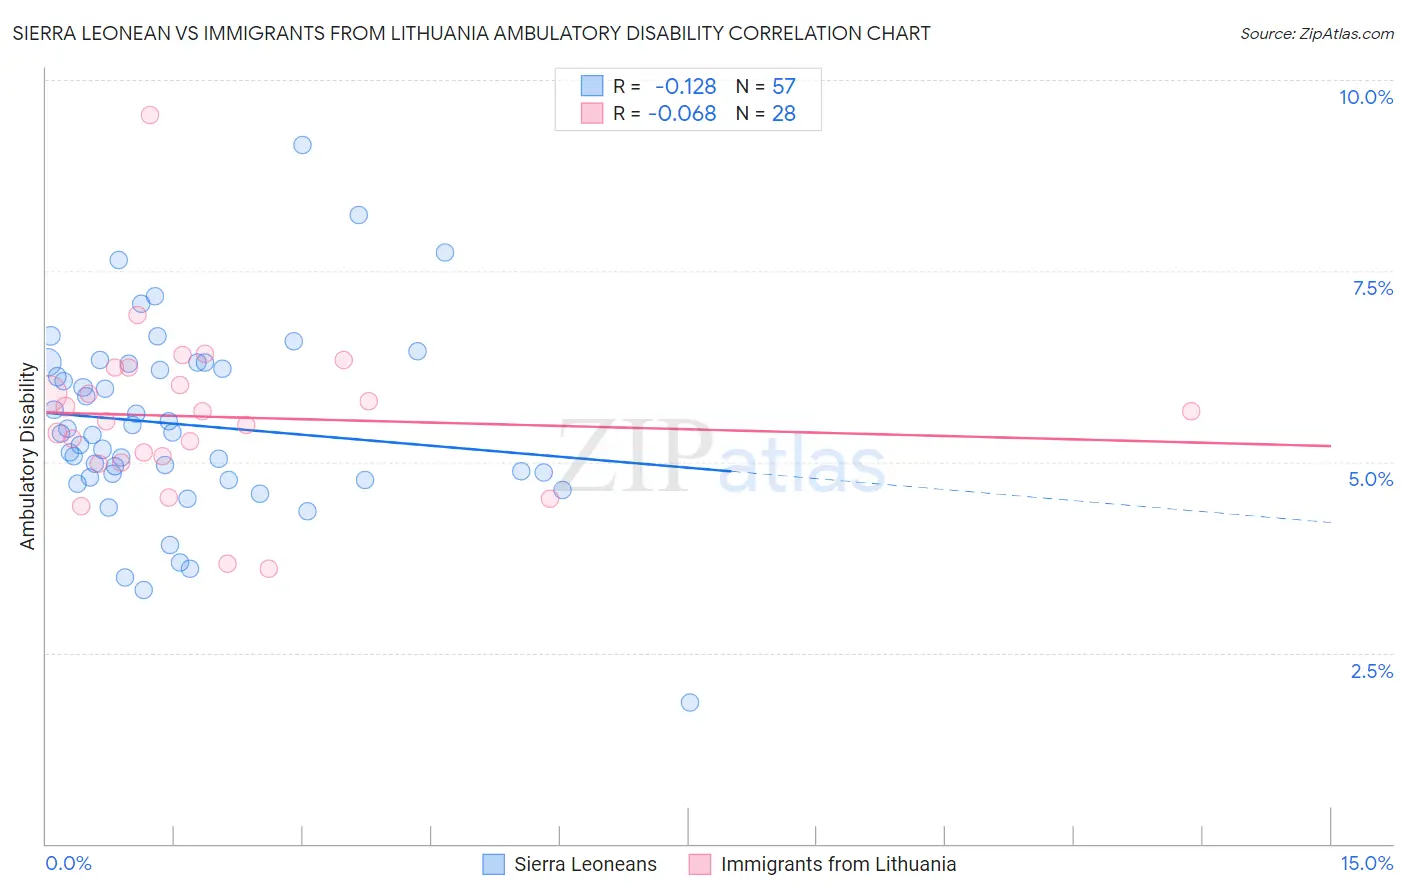
Sierra Leonean vs Immigrants from Lithuania Ambulatory Disability Correlation Chart
The statistical analysis conducted on geographies consisting of 83,336,135 people shows a poor negative correlation between the proportion of Sierra Leoneans and percentage of population with ambulatory disability in the United States with a correlation coefficient (R) of -0.128 and weighted average of 5.7%. Similarly, the statistical analysis conducted on geographies consisting of 117,713,012 people shows a slight negative correlation between the proportion of Immigrants from Lithuania and percentage of population with ambulatory disability in the United States with a correlation coefficient (R) of -0.068 and weighted average of 5.6%, a difference of 1.2%.
Ambulatory Disability Correlation Summary
| Measurement | Sierra Leonean | Immigrants from Lithuania |
| Minimum | 1.9% | 3.6% |
| Maximum | 9.1% | 9.5% |
| Range | 7.3% | 5.9% |
| Mean | 5.5% | 5.6% |
| Median | 5.4% | 5.6% |
| Interquartile 25% (IQ1) | 4.8% | 5.0% |
| Interquartile 75% (IQ3) | 6.3% | 6.1% |
| Interquartile Range (IQR) | 1.5% | 1.1% |
| Standard Deviation (Sample) | 1.3% | 1.1% |
| Standard Deviation (Population) | 1.2% | 1.1% |
Demographics Similar to Sierra Leoneans and Immigrants from Lithuania by Ambulatory Disability
In terms of ambulatory disability, the demographic groups most similar to Sierra Leoneans are Immigrants from Peru (5.7%, a difference of 0.090%), Brazilian (5.7%, a difference of 0.11%), Immigrants from Northern Africa (5.7%, a difference of 0.12%), Immigrants from Cameroon (5.7%, a difference of 0.13%), and Immigrants from South Africa (5.7%, a difference of 0.18%). Similarly, the demographic groups most similar to Immigrants from Lithuania are Immigrants from Afghanistan (5.6%, a difference of 0.040%), Immigrants from Zimbabwe (5.6%, a difference of 0.080%), Immigrants from Belgium (5.6%, a difference of 0.12%), Immigrants from Spain (5.6%, a difference of 0.13%), and Immigrants from Brazil (5.6%, a difference of 0.14%).
| Demographics | Rating | Rank | Ambulatory Disability |
| Immigrants | Bulgaria | 99.8 /100 | #55 | Exceptional 5.6% |
| Inupiat | 99.8 /100 | #56 | Exceptional 5.6% |
| Immigrants | Brazil | 99.8 /100 | #57 | Exceptional 5.6% |
| Immigrants | Zimbabwe | 99.8 /100 | #58 | Exceptional 5.6% |
| Immigrants | Afghanistan | 99.8 /100 | #59 | Exceptional 5.6% |
| Immigrants | Lithuania | 99.8 /100 | #60 | Exceptional 5.6% |
| Immigrants | Belgium | 99.7 /100 | #61 | Exceptional 5.6% |
| Immigrants | Spain | 99.7 /100 | #62 | Exceptional 5.6% |
| Immigrants | France | 99.7 /100 | #63 | Exceptional 5.6% |
| Laotians | 99.7 /100 | #64 | Exceptional 5.7% |
| Immigrants | Switzerland | 99.7 /100 | #65 | Exceptional 5.7% |
| Israelis | 99.6 /100 | #66 | Exceptional 5.7% |
| Immigrants | Uganda | 99.6 /100 | #67 | Exceptional 5.7% |
| Sri Lankans | 99.6 /100 | #68 | Exceptional 5.7% |
| Peruvians | 99.5 /100 | #69 | Exceptional 5.7% |
| Sierra Leoneans | 99.4 /100 | #70 | Exceptional 5.7% |
| Immigrants | Peru | 99.4 /100 | #71 | Exceptional 5.7% |
| Brazilians | 99.4 /100 | #72 | Exceptional 5.7% |
| Immigrants | Northern Africa | 99.4 /100 | #73 | Exceptional 5.7% |
| Immigrants | Cameroon | 99.4 /100 | #74 | Exceptional 5.7% |
| Immigrants | South Africa | 99.3 /100 | #75 | Exceptional 5.7% |