Colombian vs Chippewa Ambulatory Disability
COMPARE
Colombian
Chippewa
Ambulatory Disability
Ambulatory Disability Comparison
Colombians
Chippewa
5.8%
AMBULATORY DISABILITY
97.2/ 100
METRIC RATING
108th/ 347
METRIC RANK
7.1%
AMBULATORY DISABILITY
0.0/ 100
METRIC RATING
308th/ 347
METRIC RANK
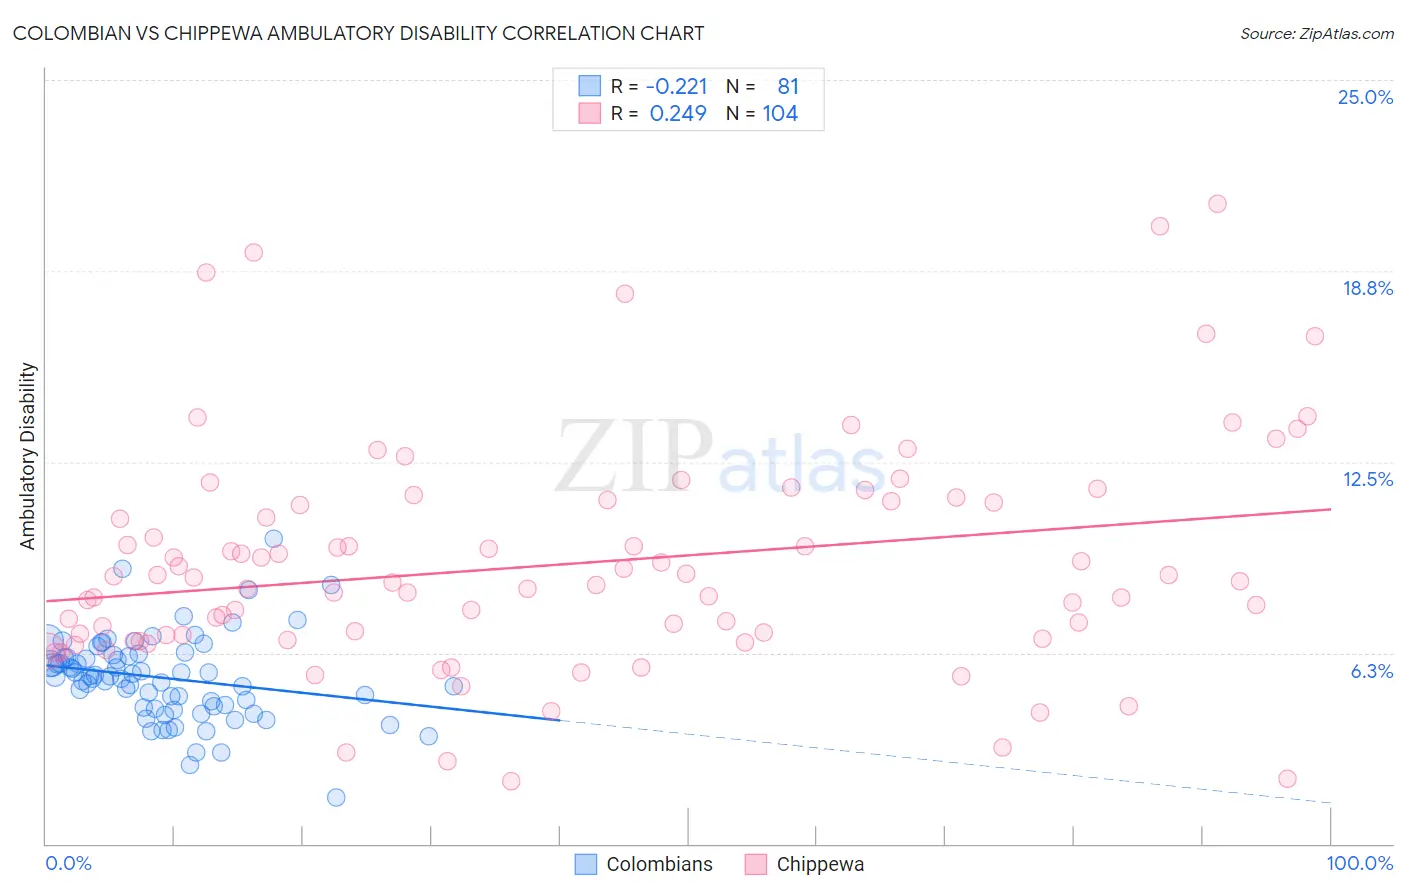
Colombian vs Chippewa Ambulatory Disability Correlation Chart
The statistical analysis conducted on geographies consisting of 419,485,288 people shows a weak negative correlation between the proportion of Colombians and percentage of population with ambulatory disability in the United States with a correlation coefficient (R) of -0.221 and weighted average of 5.8%. Similarly, the statistical analysis conducted on geographies consisting of 215,009,829 people shows a weak positive correlation between the proportion of Chippewa and percentage of population with ambulatory disability in the United States with a correlation coefficient (R) of 0.249 and weighted average of 7.1%, a difference of 21.3%.
Ambulatory Disability Correlation Summary
| Measurement | Colombian | Chippewa |
| Minimum | 1.5% | 2.0% |
| Maximum | 10.0% | 20.9% |
| Range | 8.5% | 18.9% |
| Mean | 5.4% | 9.1% |
| Median | 5.5% | 8.6% |
| Interquartile 25% (IQ1) | 4.5% | 6.8% |
| Interquartile 75% (IQ3) | 6.2% | 11.2% |
| Interquartile Range (IQR) | 1.7% | 4.4% |
| Standard Deviation (Sample) | 1.4% | 3.7% |
| Standard Deviation (Population) | 1.4% | 3.7% |
Similar Demographics by Ambulatory Disability
Demographics Similar to Colombians by Ambulatory Disability
In terms of ambulatory disability, the demographic groups most similar to Colombians are Uruguayan (5.8%, a difference of 0.010%), Immigrants from Netherlands (5.8%, a difference of 0.020%), Immigrants from Morocco (5.8%, a difference of 0.070%), Immigrants from Czechoslovakia (5.8%, a difference of 0.14%), and Immigrants from Colombia (5.8%, a difference of 0.19%).
| Demographics | Rating | Rank | Ambulatory Disability |
| Immigrants | South America | 97.9 /100 | #101 | Exceptional 5.8% |
| Immigrants | Kenya | 97.8 /100 | #102 | Exceptional 5.8% |
| Immigrants | Romania | 97.7 /100 | #103 | Exceptional 5.8% |
| New Zealanders | 97.6 /100 | #104 | Exceptional 5.8% |
| Immigrants | Czechoslovakia | 97.4 /100 | #105 | Exceptional 5.8% |
| Immigrants | Morocco | 97.3 /100 | #106 | Exceptional 5.8% |
| Uruguayans | 97.2 /100 | #107 | Exceptional 5.8% |
| Colombians | 97.2 /100 | #108 | Exceptional 5.8% |
| Immigrants | Netherlands | 97.1 /100 | #109 | Exceptional 5.8% |
| Immigrants | Colombia | 96.7 /100 | #110 | Exceptional 5.8% |
| Danes | 96.6 /100 | #111 | Exceptional 5.8% |
| South Africans | 96.3 /100 | #112 | Exceptional 5.9% |
| Immigrants | Uruguay | 95.6 /100 | #113 | Exceptional 5.9% |
| Immigrants | Poland | 95.4 /100 | #114 | Exceptional 5.9% |
| South American Indians | 94.8 /100 | #115 | Exceptional 5.9% |
Demographics Similar to Chippewa by Ambulatory Disability
In terms of ambulatory disability, the demographic groups most similar to Chippewa are Spanish American (7.1%, a difference of 0.0%), Immigrants from the Azores (7.1%, a difference of 0.17%), Iroquois (7.1%, a difference of 0.27%), Arapaho (7.1%, a difference of 0.45%), and Cree (7.1%, a difference of 0.46%).
| Demographics | Rating | Rank | Ambulatory Disability |
| British West Indians | 0.0 /100 | #301 | Tragic 7.0% |
| Immigrants | Armenia | 0.0 /100 | #302 | Tragic 7.0% |
| Africans | 0.0 /100 | #303 | Tragic 7.0% |
| Immigrants | Cabo Verde | 0.0 /100 | #304 | Tragic 7.0% |
| Immigrants | Micronesia | 0.0 /100 | #305 | Tragic 7.0% |
| Iroquois | 0.0 /100 | #306 | Tragic 7.1% |
| Spanish Americans | 0.0 /100 | #307 | Tragic 7.1% |
| Chippewa | 0.0 /100 | #308 | Tragic 7.1% |
| Immigrants | Azores | 0.0 /100 | #309 | Tragic 7.1% |
| Arapaho | 0.0 /100 | #310 | Tragic 7.1% |
| Cree | 0.0 /100 | #311 | Tragic 7.1% |
| Delaware | 0.0 /100 | #312 | Tragic 7.1% |
| Immigrants | Yemen | 0.0 /100 | #313 | Tragic 7.1% |
| Blackfeet | 0.0 /100 | #314 | Tragic 7.1% |
| Shoshone | 0.0 /100 | #315 | Tragic 7.1% |