Sierra Leonean vs Cambodian Ambulatory Disability
COMPARE
Sierra Leonean
Cambodian
Ambulatory Disability
Ambulatory Disability Comparison
Sierra Leoneans
Cambodians
5.7%
AMBULATORY DISABILITY
99.4/ 100
METRIC RATING
70th/ 347
METRIC RANK
5.4%
AMBULATORY DISABILITY
100.0/ 100
METRIC RATING
28th/ 347
METRIC RANK
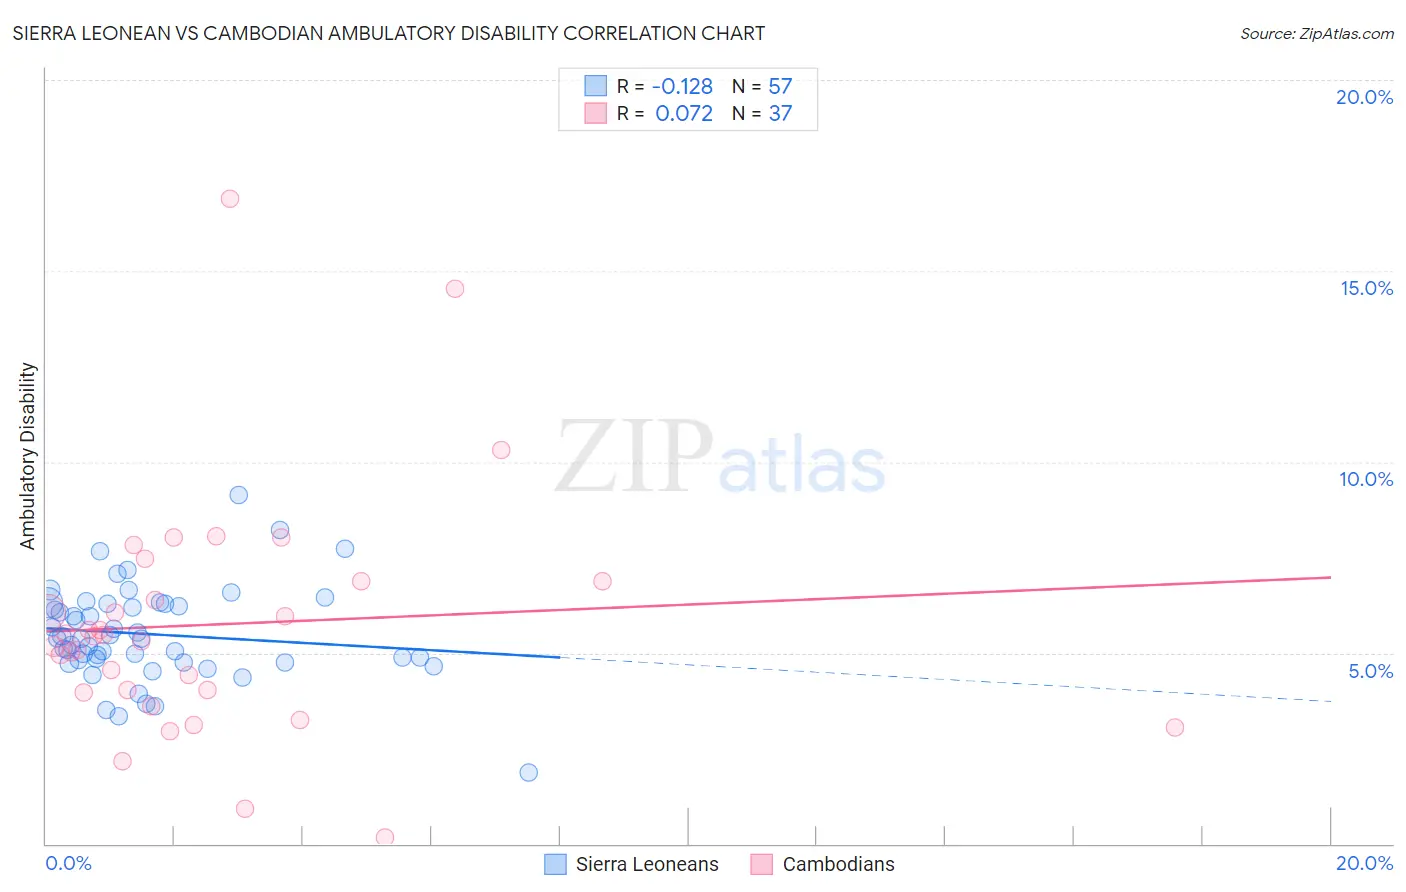
Sierra Leonean vs Cambodian Ambulatory Disability Correlation Chart
The statistical analysis conducted on geographies consisting of 83,336,135 people shows a poor negative correlation between the proportion of Sierra Leoneans and percentage of population with ambulatory disability in the United States with a correlation coefficient (R) of -0.128 and weighted average of 5.7%. Similarly, the statistical analysis conducted on geographies consisting of 102,504,705 people shows a slight positive correlation between the proportion of Cambodians and percentage of population with ambulatory disability in the United States with a correlation coefficient (R) of 0.072 and weighted average of 5.4%, a difference of 5.4%.
Ambulatory Disability Correlation Summary
| Measurement | Sierra Leonean | Cambodian |
| Minimum | 1.9% | 0.17% |
| Maximum | 9.1% | 16.9% |
| Range | 7.3% | 16.7% |
| Mean | 5.5% | 5.7% |
| Median | 5.4% | 5.4% |
| Interquartile 25% (IQ1) | 4.8% | 4.0% |
| Interquartile 75% (IQ3) | 6.3% | 6.9% |
| Interquartile Range (IQR) | 1.5% | 2.9% |
| Standard Deviation (Sample) | 1.3% | 3.2% |
| Standard Deviation (Population) | 1.2% | 3.1% |
Similar Demographics by Ambulatory Disability
Demographics Similar to Sierra Leoneans by Ambulatory Disability
In terms of ambulatory disability, the demographic groups most similar to Sierra Leoneans are Immigrants from Peru (5.7%, a difference of 0.090%), Brazilian (5.7%, a difference of 0.11%), Immigrants from Northern Africa (5.7%, a difference of 0.12%), Immigrants from Cameroon (5.7%, a difference of 0.13%), and Immigrants from South Africa (5.7%, a difference of 0.18%).
| Demographics | Rating | Rank | Ambulatory Disability |
| Immigrants | France | 99.7 /100 | #63 | Exceptional 5.6% |
| Laotians | 99.7 /100 | #64 | Exceptional 5.7% |
| Immigrants | Switzerland | 99.7 /100 | #65 | Exceptional 5.7% |
| Israelis | 99.6 /100 | #66 | Exceptional 5.7% |
| Immigrants | Uganda | 99.6 /100 | #67 | Exceptional 5.7% |
| Sri Lankans | 99.6 /100 | #68 | Exceptional 5.7% |
| Peruvians | 99.5 /100 | #69 | Exceptional 5.7% |
| Sierra Leoneans | 99.4 /100 | #70 | Exceptional 5.7% |
| Immigrants | Peru | 99.4 /100 | #71 | Exceptional 5.7% |
| Brazilians | 99.4 /100 | #72 | Exceptional 5.7% |
| Immigrants | Northern Africa | 99.4 /100 | #73 | Exceptional 5.7% |
| Immigrants | Cameroon | 99.4 /100 | #74 | Exceptional 5.7% |
| Immigrants | South Africa | 99.3 /100 | #75 | Exceptional 5.7% |
| Sudanese | 99.3 /100 | #76 | Exceptional 5.7% |
| Immigrants | Vietnam | 99.3 /100 | #77 | Exceptional 5.7% |
Demographics Similar to Cambodians by Ambulatory Disability
In terms of ambulatory disability, the demographic groups most similar to Cambodians are Asian (5.4%, a difference of 0.060%), Immigrants from Iran (5.4%, a difference of 0.10%), Immigrants from Nepal (5.4%, a difference of 0.22%), Zimbabwean (5.4%, a difference of 0.25%), and Immigrants from Saudi Arabia (5.4%, a difference of 0.33%).
| Demographics | Rating | Rank | Ambulatory Disability |
| Immigrants | Kuwait | 100.0 /100 | #21 | Exceptional 5.4% |
| Immigrants | Israel | 100.0 /100 | #22 | Exceptional 5.4% |
| Tongans | 100.0 /100 | #23 | Exceptional 5.4% |
| Immigrants | Saudi Arabia | 100.0 /100 | #24 | Exceptional 5.4% |
| Zimbabweans | 100.0 /100 | #25 | Exceptional 5.4% |
| Immigrants | Nepal | 100.0 /100 | #26 | Exceptional 5.4% |
| Asians | 100.0 /100 | #27 | Exceptional 5.4% |
| Cambodians | 100.0 /100 | #28 | Exceptional 5.4% |
| Immigrants | Iran | 100.0 /100 | #29 | Exceptional 5.4% |
| Immigrants | Turkey | 100.0 /100 | #30 | Exceptional 5.4% |
| Immigrants | Venezuela | 100.0 /100 | #31 | Exceptional 5.4% |
| Immigrants | Australia | 100.0 /100 | #32 | Exceptional 5.5% |
| Immigrants | Pakistan | 100.0 /100 | #33 | Exceptional 5.5% |
| Immigrants | Asia | 100.0 /100 | #34 | Exceptional 5.5% |
| Afghans | 100.0 /100 | #35 | Exceptional 5.5% |