Sierra Leonean vs Assyrian/Chaldean/Syriac Ambulatory Disability
COMPARE
Sierra Leonean
Assyrian/Chaldean/Syriac
Ambulatory Disability
Ambulatory Disability Comparison
Sierra Leoneans
Assyrians/Chaldeans/Syriacs
5.7%
AMBULATORY DISABILITY
99.4/ 100
METRIC RATING
70th/ 347
METRIC RANK
6.4%
AMBULATORY DISABILITY
2.4/ 100
METRIC RATING
232nd/ 347
METRIC RANK
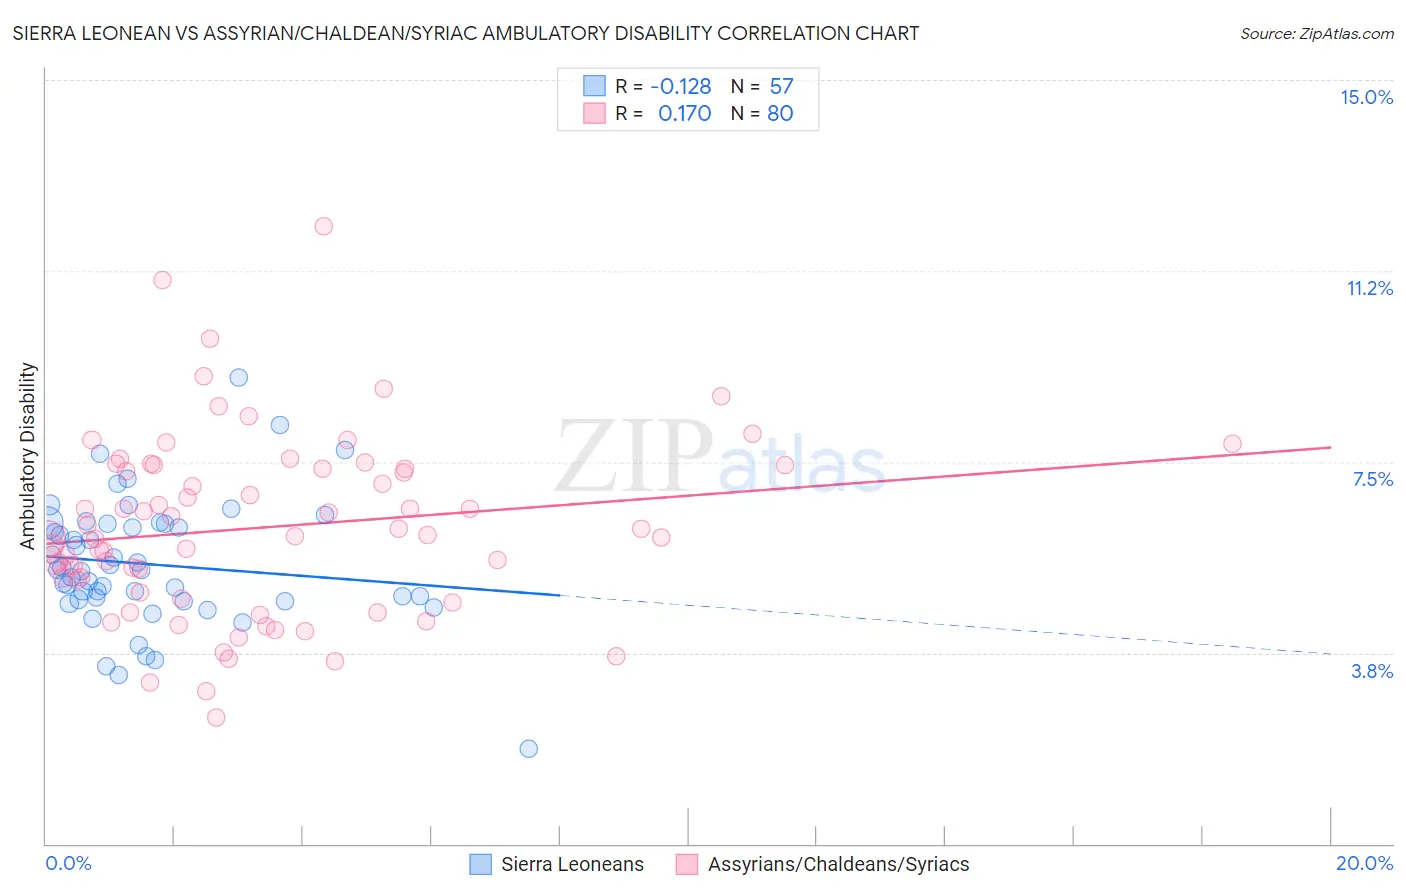
Sierra Leonean vs Assyrian/Chaldean/Syriac Ambulatory Disability Correlation Chart
The statistical analysis conducted on geographies consisting of 83,336,135 people shows a poor negative correlation between the proportion of Sierra Leoneans and percentage of population with ambulatory disability in the United States with a correlation coefficient (R) of -0.128 and weighted average of 5.7%. Similarly, the statistical analysis conducted on geographies consisting of 110,309,207 people shows a poor positive correlation between the proportion of Assyrians/Chaldeans/Syriacs and percentage of population with ambulatory disability in the United States with a correlation coefficient (R) of 0.170 and weighted average of 6.4%, a difference of 12.6%.
Ambulatory Disability Correlation Summary
| Measurement | Sierra Leonean | Assyrian/Chaldean/Syriac |
| Minimum | 1.9% | 2.5% |
| Maximum | 9.1% | 12.1% |
| Range | 7.3% | 9.7% |
| Mean | 5.5% | 6.2% |
| Median | 5.4% | 6.1% |
| Interquartile 25% (IQ1) | 4.8% | 5.1% |
| Interquartile 75% (IQ3) | 6.3% | 7.4% |
| Interquartile Range (IQR) | 1.5% | 2.3% |
| Standard Deviation (Sample) | 1.3% | 1.8% |
| Standard Deviation (Population) | 1.2% | 1.8% |
Similar Demographics by Ambulatory Disability
Demographics Similar to Sierra Leoneans by Ambulatory Disability
In terms of ambulatory disability, the demographic groups most similar to Sierra Leoneans are Immigrants from Peru (5.7%, a difference of 0.090%), Brazilian (5.7%, a difference of 0.11%), Immigrants from Northern Africa (5.7%, a difference of 0.12%), Immigrants from Cameroon (5.7%, a difference of 0.13%), and Immigrants from South Africa (5.7%, a difference of 0.18%).
| Demographics | Rating | Rank | Ambulatory Disability |
| Immigrants | France | 99.7 /100 | #63 | Exceptional 5.6% |
| Laotians | 99.7 /100 | #64 | Exceptional 5.7% |
| Immigrants | Switzerland | 99.7 /100 | #65 | Exceptional 5.7% |
| Israelis | 99.6 /100 | #66 | Exceptional 5.7% |
| Immigrants | Uganda | 99.6 /100 | #67 | Exceptional 5.7% |
| Sri Lankans | 99.6 /100 | #68 | Exceptional 5.7% |
| Peruvians | 99.5 /100 | #69 | Exceptional 5.7% |
| Sierra Leoneans | 99.4 /100 | #70 | Exceptional 5.7% |
| Immigrants | Peru | 99.4 /100 | #71 | Exceptional 5.7% |
| Brazilians | 99.4 /100 | #72 | Exceptional 5.7% |
| Immigrants | Northern Africa | 99.4 /100 | #73 | Exceptional 5.7% |
| Immigrants | Cameroon | 99.4 /100 | #74 | Exceptional 5.7% |
| Immigrants | South Africa | 99.3 /100 | #75 | Exceptional 5.7% |
| Sudanese | 99.3 /100 | #76 | Exceptional 5.7% |
| Immigrants | Vietnam | 99.3 /100 | #77 | Exceptional 5.7% |
Demographics Similar to Assyrians/Chaldeans/Syriacs by Ambulatory Disability
In terms of ambulatory disability, the demographic groups most similar to Assyrians/Chaldeans/Syriacs are Subsaharan African (6.4%, a difference of 0.060%), Immigrants from Liberia (6.4%, a difference of 0.090%), Hispanic or Latino (6.4%, a difference of 0.12%), Dutch (6.4%, a difference of 0.27%), and Panamanian (6.4%, a difference of 0.33%).
| Demographics | Rating | Rank | Ambulatory Disability |
| Hondurans | 6.3 /100 | #225 | Tragic 6.3% |
| Slavs | 5.1 /100 | #226 | Tragic 6.4% |
| Cubans | 4.0 /100 | #227 | Tragic 6.4% |
| Portuguese | 4.0 /100 | #228 | Tragic 6.4% |
| Czechoslovakians | 3.8 /100 | #229 | Tragic 6.4% |
| Mexicans | 3.5 /100 | #230 | Tragic 6.4% |
| Panamanians | 3.1 /100 | #231 | Tragic 6.4% |
| Assyrians/Chaldeans/Syriacs | 2.4 /100 | #232 | Tragic 6.4% |
| Sub-Saharan Africans | 2.3 /100 | #233 | Tragic 6.4% |
| Immigrants | Liberia | 2.3 /100 | #234 | Tragic 6.4% |
| Hispanics or Latinos | 2.2 /100 | #235 | Tragic 6.4% |
| Dutch | 2.0 /100 | #236 | Tragic 6.4% |
| Immigrants | Germany | 1.8 /100 | #237 | Tragic 6.4% |
| Haitians | 1.8 /100 | #238 | Tragic 6.4% |
| Senegalese | 1.7 /100 | #239 | Tragic 6.4% |