Sierra Leonean vs Chippewa 1 or more Vehicles in Household
COMPARE
Sierra Leonean
Chippewa
1 or more Vehicles in Household
1 or more Vehicles in Household Comparison
Sierra Leoneans
Chippewa
89.0%
1 OR MORE VEHICLES IN HOUSEHOLD
13.0/ 100
METRIC RATING
211th/ 347
METRIC RANK
90.7%
1 OR MORE VEHICLES IN HOUSEHOLD
94.3/ 100
METRIC RATING
116th/ 347
METRIC RANK
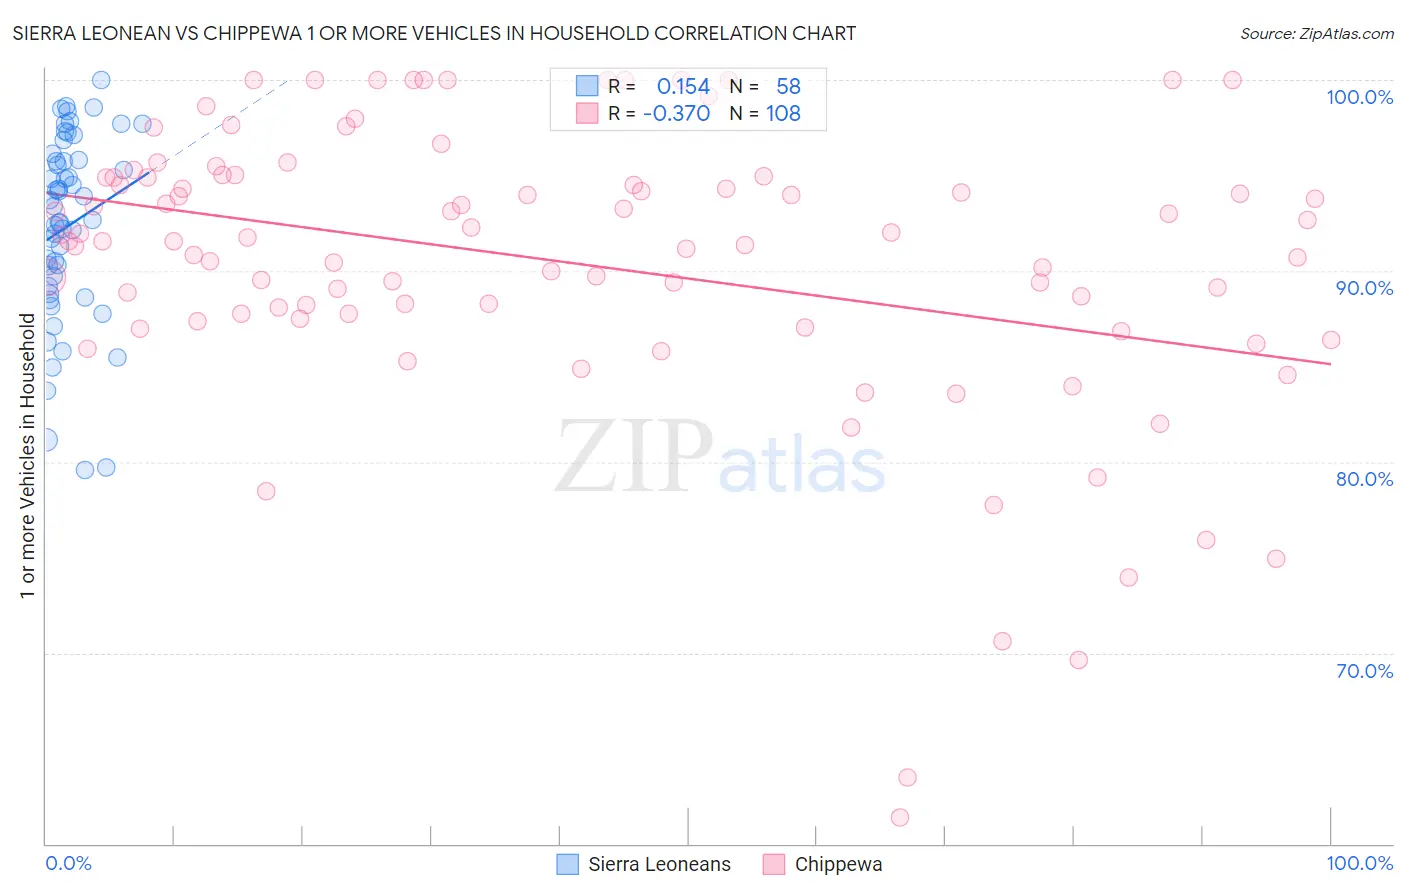
Sierra Leonean vs Chippewa 1 or more Vehicles in Household Correlation Chart
The statistical analysis conducted on geographies consisting of 83,323,468 people shows a poor positive correlation between the proportion of Sierra Leoneans and percentage of households with 1 or more vehicles available in the United States with a correlation coefficient (R) of 0.154 and weighted average of 89.0%. Similarly, the statistical analysis conducted on geographies consisting of 215,015,305 people shows a mild negative correlation between the proportion of Chippewa and percentage of households with 1 or more vehicles available in the United States with a correlation coefficient (R) of -0.370 and weighted average of 90.7%, a difference of 1.8%.
1 or more Vehicles in Household Correlation Summary
| Measurement | Sierra Leonean | Chippewa |
| Minimum | 79.6% | 61.4% |
| Maximum | 100.0% | 100.0% |
| Range | 20.4% | 38.6% |
| Mean | 92.4% | 90.4% |
| Median | 93.0% | 91.5% |
| Interquartile 25% (IQ1) | 89.2% | 87.6% |
| Interquartile 75% (IQ3) | 95.8% | 94.9% |
| Interquartile Range (IQR) | 6.6% | 7.3% |
| Standard Deviation (Sample) | 4.9% | 7.5% |
| Standard Deviation (Population) | 4.9% | 7.5% |
Similar Demographics by 1 or more Vehicles in Household
Demographics Similar to Sierra Leoneans by 1 or more Vehicles in Household
In terms of 1 or more vehicles in household, the demographic groups most similar to Sierra Leoneans are Somali (89.0%, a difference of 0.010%), Dutch West Indian (89.0%, a difference of 0.020%), Immigrants from Italy (89.1%, a difference of 0.030%), Immigrants from Western Asia (89.0%, a difference of 0.030%), and Immigrants from Hungary (89.0%, a difference of 0.040%).
| Demographics | Rating | Rank | 1 or more Vehicles in Household |
| Romanians | 18.2 /100 | #204 | Poor 89.2% |
| Guatemalans | 17.8 /100 | #205 | Poor 89.2% |
| Apache | 16.2 /100 | #206 | Poor 89.1% |
| Immigrants | Denmark | 14.8 /100 | #207 | Poor 89.1% |
| Immigrants | Chile | 14.4 /100 | #208 | Poor 89.1% |
| Immigrants | Italy | 14.0 /100 | #209 | Poor 89.1% |
| Dutch West Indians | 13.5 /100 | #210 | Poor 89.0% |
| Sierra Leoneans | 13.0 /100 | #211 | Poor 89.0% |
| Somalis | 12.8 /100 | #212 | Poor 89.0% |
| Immigrants | Western Asia | 12.3 /100 | #213 | Poor 89.0% |
| Immigrants | Hungary | 11.9 /100 | #214 | Poor 89.0% |
| Immigrants | Sri Lanka | 10.2 /100 | #215 | Poor 88.9% |
| Immigrants | Argentina | 9.4 /100 | #216 | Tragic 88.9% |
| Argentineans | 8.8 /100 | #217 | Tragic 88.9% |
| Ugandans | 8.7 /100 | #218 | Tragic 88.9% |
Demographics Similar to Chippewa by 1 or more Vehicles in Household
In terms of 1 or more vehicles in household, the demographic groups most similar to Chippewa are Serbian (90.7%, a difference of 0.0%), Armenian (90.7%, a difference of 0.020%), Immigrants from Kuwait (90.7%, a difference of 0.030%), Greek (90.6%, a difference of 0.050%), and Japanese (90.6%, a difference of 0.060%).
| Demographics | Rating | Rank | 1 or more Vehicles in Household |
| Delaware | 97.6 /100 | #109 | Exceptional 91.0% |
| Mexican American Indians | 97.4 /100 | #110 | Exceptional 91.0% |
| Navajo | 95.8 /100 | #111 | Exceptional 90.8% |
| Immigrants | Netherlands | 95.7 /100 | #112 | Exceptional 90.8% |
| Immigrants | Kuwait | 94.7 /100 | #113 | Exceptional 90.7% |
| Armenians | 94.5 /100 | #114 | Exceptional 90.7% |
| Serbians | 94.3 /100 | #115 | Exceptional 90.7% |
| Chippewa | 94.3 /100 | #116 | Exceptional 90.7% |
| Greeks | 93.5 /100 | #117 | Exceptional 90.6% |
| Japanese | 93.4 /100 | #118 | Exceptional 90.6% |
| Blackfeet | 92.6 /100 | #119 | Exceptional 90.6% |
| Immigrants | Thailand | 92.3 /100 | #120 | Exceptional 90.6% |
| Icelanders | 92.1 /100 | #121 | Exceptional 90.5% |
| Costa Ricans | 92.0 /100 | #122 | Exceptional 90.5% |
| Fijians | 91.8 /100 | #123 | Exceptional 90.5% |