Welsh vs Chippewa Ambulatory Disability
COMPARE
Welsh
Chippewa
Ambulatory Disability
Ambulatory Disability Comparison
Welsh
Chippewa
6.5%
AMBULATORY DISABILITY
0.6/ 100
METRIC RATING
255th/ 347
METRIC RANK
7.1%
AMBULATORY DISABILITY
0.0/ 100
METRIC RATING
308th/ 347
METRIC RANK
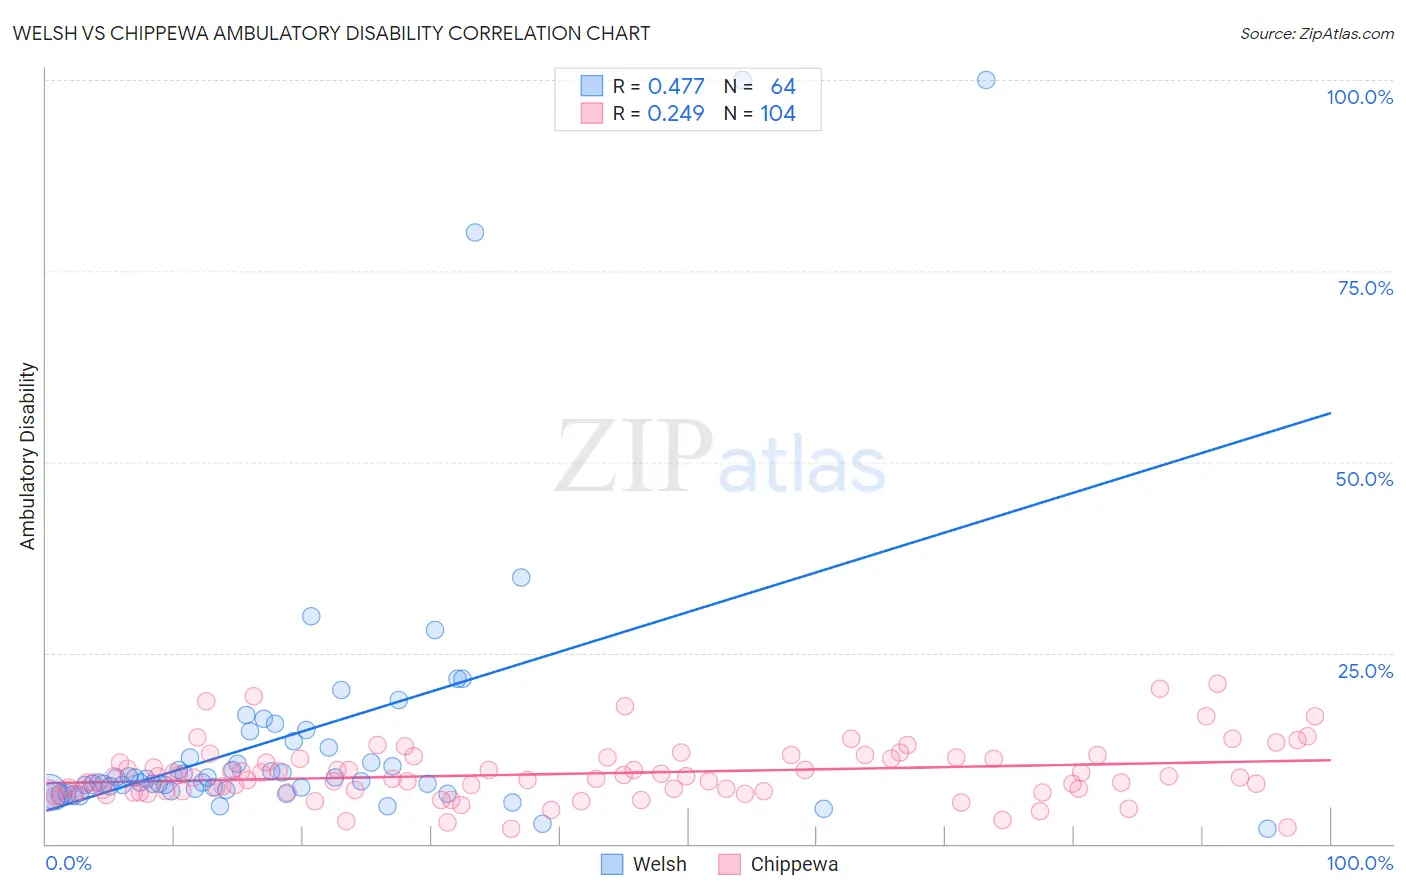
Welsh vs Chippewa Ambulatory Disability Correlation Chart
The statistical analysis conducted on geographies consisting of 528,297,668 people shows a moderate positive correlation between the proportion of Welsh and percentage of population with ambulatory disability in the United States with a correlation coefficient (R) of 0.477 and weighted average of 6.5%. Similarly, the statistical analysis conducted on geographies consisting of 215,009,829 people shows a weak positive correlation between the proportion of Chippewa and percentage of population with ambulatory disability in the United States with a correlation coefficient (R) of 0.249 and weighted average of 7.1%, a difference of 8.3%.
Ambulatory Disability Correlation Summary
| Measurement | Welsh | Chippewa |
| Minimum | 2.0% | 2.0% |
| Maximum | 100.0% | 20.9% |
| Range | 98.0% | 18.9% |
| Mean | 14.3% | 9.1% |
| Median | 8.3% | 8.6% |
| Interquartile 25% (IQ1) | 7.1% | 6.8% |
| Interquartile 75% (IQ3) | 13.0% | 11.2% |
| Interquartile Range (IQR) | 5.9% | 4.4% |
| Standard Deviation (Sample) | 18.8% | 3.7% |
| Standard Deviation (Population) | 18.7% | 3.7% |
Similar Demographics by Ambulatory Disability
Demographics Similar to Welsh by Ambulatory Disability
In terms of ambulatory disability, the demographic groups most similar to Welsh are Belizean (6.5%, a difference of 0.070%), Immigrants from Uzbekistan (6.5%, a difference of 0.080%), Bermudan (6.5%, a difference of 0.16%), Scottish (6.5%, a difference of 0.23%), and Spanish American Indian (6.5%, a difference of 0.23%).
| Demographics | Rating | Rank | Ambulatory Disability |
| Immigrants | Portugal | 1.4 /100 | #248 | Tragic 6.5% |
| Native Hawaiians | 1.1 /100 | #249 | Tragic 6.5% |
| Chinese | 1.0 /100 | #250 | Tragic 6.5% |
| Hawaiians | 0.9 /100 | #251 | Tragic 6.5% |
| Immigrants | Bahamas | 0.8 /100 | #252 | Tragic 6.5% |
| Scottish | 0.7 /100 | #253 | Tragic 6.5% |
| Belizeans | 0.7 /100 | #254 | Tragic 6.5% |
| Welsh | 0.6 /100 | #255 | Tragic 6.5% |
| Immigrants | Uzbekistan | 0.6 /100 | #256 | Tragic 6.5% |
| Bermudans | 0.5 /100 | #257 | Tragic 6.5% |
| Spanish American Indians | 0.5 /100 | #258 | Tragic 6.5% |
| Aleuts | 0.4 /100 | #259 | Tragic 6.6% |
| Immigrants | Belize | 0.4 /100 | #260 | Tragic 6.6% |
| Irish | 0.4 /100 | #261 | Tragic 6.6% |
| English | 0.4 /100 | #262 | Tragic 6.6% |
Demographics Similar to Chippewa by Ambulatory Disability
In terms of ambulatory disability, the demographic groups most similar to Chippewa are Spanish American (7.1%, a difference of 0.0%), Immigrants from the Azores (7.1%, a difference of 0.17%), Iroquois (7.1%, a difference of 0.27%), Arapaho (7.1%, a difference of 0.45%), and Cree (7.1%, a difference of 0.46%).
| Demographics | Rating | Rank | Ambulatory Disability |
| British West Indians | 0.0 /100 | #301 | Tragic 7.0% |
| Immigrants | Armenia | 0.0 /100 | #302 | Tragic 7.0% |
| Africans | 0.0 /100 | #303 | Tragic 7.0% |
| Immigrants | Cabo Verde | 0.0 /100 | #304 | Tragic 7.0% |
| Immigrants | Micronesia | 0.0 /100 | #305 | Tragic 7.0% |
| Iroquois | 0.0 /100 | #306 | Tragic 7.1% |
| Spanish Americans | 0.0 /100 | #307 | Tragic 7.1% |
| Chippewa | 0.0 /100 | #308 | Tragic 7.1% |
| Immigrants | Azores | 0.0 /100 | #309 | Tragic 7.1% |
| Arapaho | 0.0 /100 | #310 | Tragic 7.1% |
| Cree | 0.0 /100 | #311 | Tragic 7.1% |
| Delaware | 0.0 /100 | #312 | Tragic 7.1% |
| Immigrants | Yemen | 0.0 /100 | #313 | Tragic 7.1% |
| Blackfeet | 0.0 /100 | #314 | Tragic 7.1% |
| Shoshone | 0.0 /100 | #315 | Tragic 7.1% |