Nonimmigrants vs Liberian Disability Age 18 to 34
COMPARE
Nonimmigrants
Liberian
Disability Age 18 to 34
Disability Age 18 to 34 Comparison
Nonimmigrants
Liberians
7.6%
DISABILITY AGE 18 TO 34
0.0/ 100
METRIC RATING
289th/ 347
METRIC RANK
7.1%
DISABILITY AGE 18 TO 34
1.5/ 100
METRIC RATING
236th/ 347
METRIC RANK
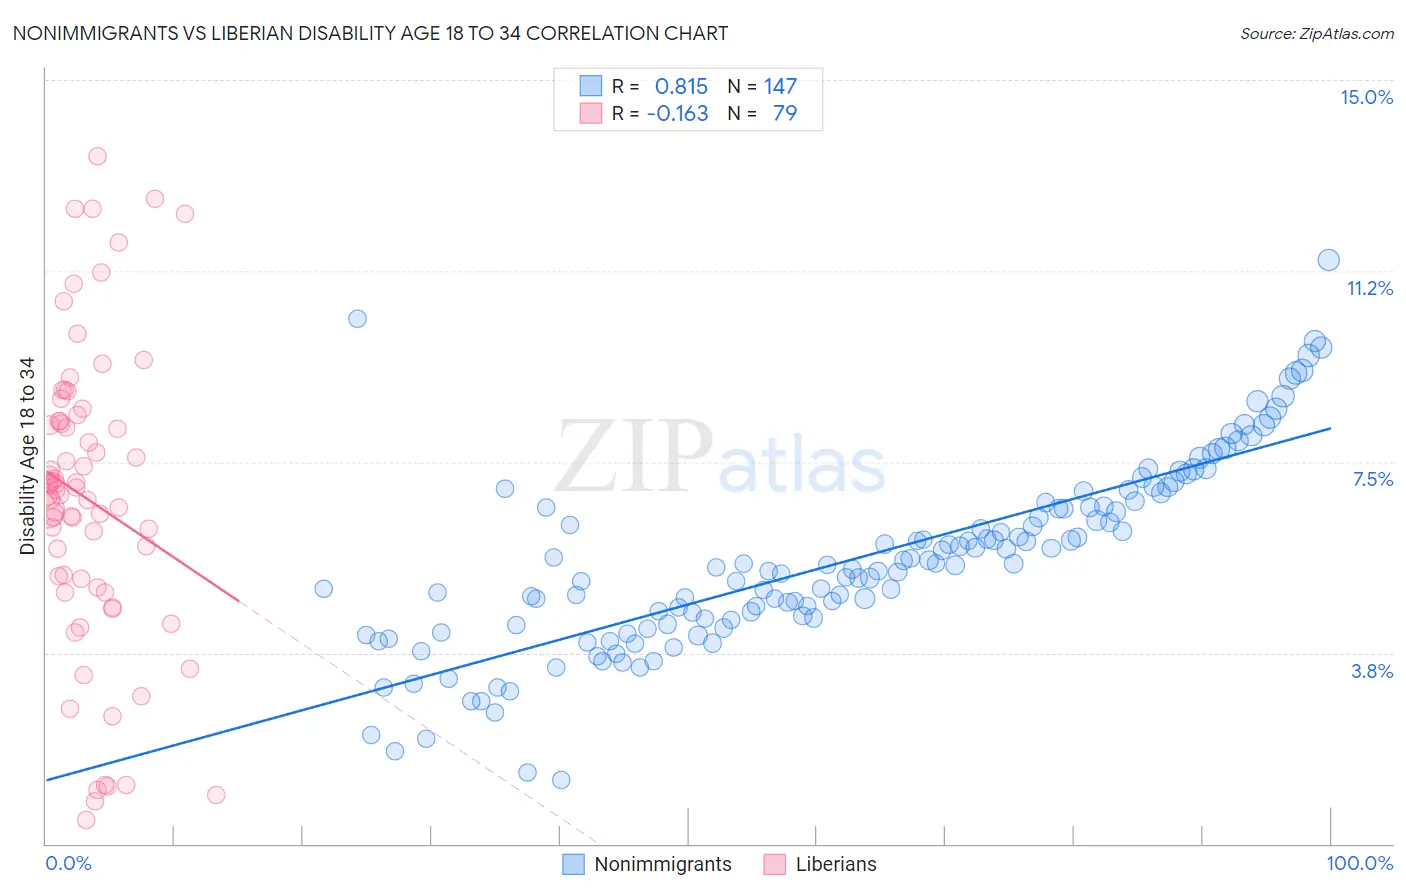
Nonimmigrants vs Liberian Disability Age 18 to 34 Correlation Chart
The statistical analysis conducted on geographies consisting of 576,503,719 people shows a very strong positive correlation between the proportion of Nonimmigrants and percentage of population with a disability between the ages 18 and 35 in the United States with a correlation coefficient (R) of 0.815 and weighted average of 7.6%. Similarly, the statistical analysis conducted on geographies consisting of 118,043,713 people shows a poor negative correlation between the proportion of Liberians and percentage of population with a disability between the ages 18 and 35 in the United States with a correlation coefficient (R) of -0.163 and weighted average of 7.1%, a difference of 8.0%.
Disability Age 18 to 34 Correlation Summary
| Measurement | Nonimmigrants | Liberian |
| Minimum | 1.3% | 0.47% |
| Maximum | 11.5% | 13.5% |
| Range | 10.2% | 13.0% |
| Mean | 5.6% | 6.8% |
| Median | 5.5% | 7.0% |
| Interquartile 25% (IQ1) | 4.4% | 5.0% |
| Interquartile 75% (IQ3) | 6.6% | 8.3% |
| Interquartile Range (IQR) | 2.2% | 3.3% |
| Standard Deviation (Sample) | 1.8% | 3.0% |
| Standard Deviation (Population) | 1.8% | 2.9% |
Similar Demographics by Disability Age 18 to 34
Demographics Similar to Nonimmigrants by Disability Age 18 to 34
In terms of disability age 18 to 34, the demographic groups most similar to Nonimmigrants are Slovak (7.7%, a difference of 0.090%), White/Caucasian (7.6%, a difference of 0.12%), Irish (7.7%, a difference of 0.13%), Norwegian (7.6%, a difference of 0.21%), and Black/African American (7.7%, a difference of 0.36%).
| Demographics | Rating | Rank | Disability Age 18 to 34 |
| Spanish | 0.0 /100 | #282 | Tragic 7.5% |
| Danes | 0.0 /100 | #283 | Tragic 7.5% |
| Hopi | 0.0 /100 | #284 | Tragic 7.5% |
| Swedes | 0.0 /100 | #285 | Tragic 7.5% |
| Celtics | 0.0 /100 | #286 | Tragic 7.6% |
| Norwegians | 0.0 /100 | #287 | Tragic 7.6% |
| Whites/Caucasians | 0.0 /100 | #288 | Tragic 7.6% |
| Immigrants | Nonimmigrants | 0.0 /100 | #289 | Tragic 7.6% |
| Slovaks | 0.0 /100 | #290 | Tragic 7.7% |
| Irish | 0.0 /100 | #291 | Tragic 7.7% |
| Blacks/African Americans | 0.0 /100 | #292 | Tragic 7.7% |
| Scandinavians | 0.0 /100 | #293 | Tragic 7.7% |
| Immigrants | Cabo Verde | 0.0 /100 | #294 | Tragic 7.7% |
| Tlingit-Haida | 0.0 /100 | #295 | Tragic 7.7% |
| Cape Verdeans | 0.0 /100 | #296 | Tragic 7.7% |
Demographics Similar to Liberians by Disability Age 18 to 34
In terms of disability age 18 to 34, the demographic groups most similar to Liberians are Austrian (7.1%, a difference of 0.17%), Marshallese (7.1%, a difference of 0.22%), Subsaharan African (7.1%, a difference of 0.25%), Italian (7.1%, a difference of 0.33%), and Arapaho (7.1%, a difference of 0.45%).
| Demographics | Rating | Rank | Disability Age 18 to 34 |
| Lithuanians | 4.1 /100 | #229 | Tragic 7.0% |
| Immigrants | North America | 3.9 /100 | #230 | Tragic 7.0% |
| Ute | 3.8 /100 | #231 | Tragic 7.0% |
| Samoans | 3.2 /100 | #232 | Tragic 7.0% |
| New Zealanders | 2.7 /100 | #233 | Tragic 7.0% |
| Alsatians | 2.1 /100 | #234 | Tragic 7.0% |
| Sub-Saharan Africans | 1.7 /100 | #235 | Tragic 7.1% |
| Liberians | 1.5 /100 | #236 | Tragic 7.1% |
| Austrians | 1.3 /100 | #237 | Tragic 7.1% |
| Marshallese | 1.3 /100 | #238 | Tragic 7.1% |
| Italians | 1.2 /100 | #239 | Tragic 7.1% |
| Arapaho | 1.1 /100 | #240 | Tragic 7.1% |
| Nepalese | 1.1 /100 | #241 | Tragic 7.1% |
| Immigrants | Congo | 1.1 /100 | #242 | Tragic 7.1% |
| Icelanders | 1.0 /100 | #243 | Tragic 7.1% |