British West Indian vs Liberian Disability Age 18 to 34
COMPARE
British West Indian
Liberian
Disability Age 18 to 34
Disability Age 18 to 34 Comparison
British West Indians
Liberians
6.0%
DISABILITY AGE 18 TO 34
99.6/ 100
METRIC RATING
61st/ 347
METRIC RANK
7.1%
DISABILITY AGE 18 TO 34
1.5/ 100
METRIC RATING
236th/ 347
METRIC RANK
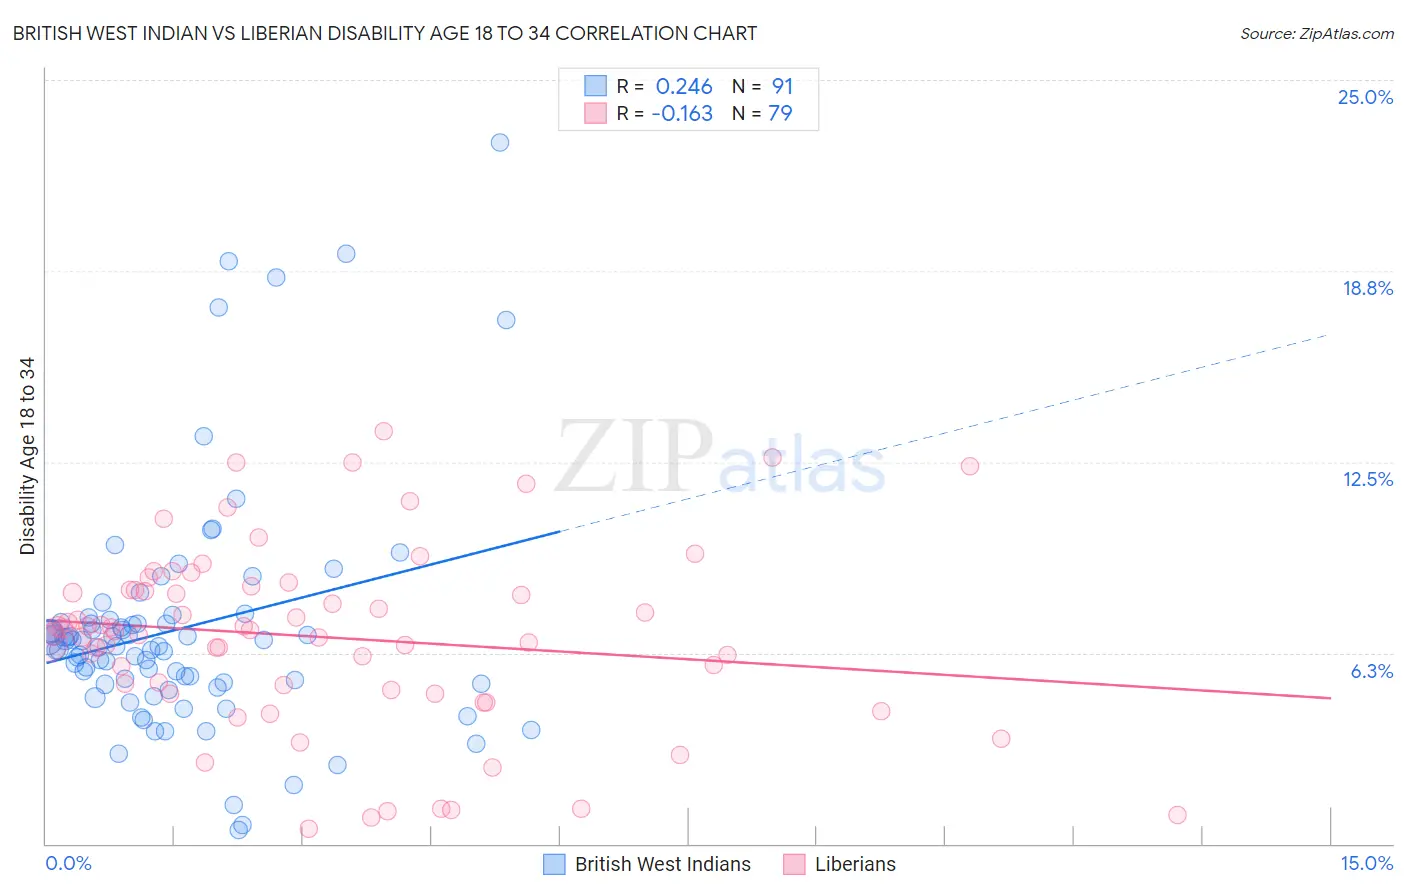
British West Indian vs Liberian Disability Age 18 to 34 Correlation Chart
The statistical analysis conducted on geographies consisting of 152,620,566 people shows a weak positive correlation between the proportion of British West Indians and percentage of population with a disability between the ages 18 and 35 in the United States with a correlation coefficient (R) of 0.246 and weighted average of 6.0%. Similarly, the statistical analysis conducted on geographies consisting of 118,043,713 people shows a poor negative correlation between the proportion of Liberians and percentage of population with a disability between the ages 18 and 35 in the United States with a correlation coefficient (R) of -0.163 and weighted average of 7.1%, a difference of 18.6%.
Disability Age 18 to 34 Correlation Summary
| Measurement | British West Indian | Liberian |
| Minimum | 0.44% | 0.47% |
| Maximum | 23.0% | 13.5% |
| Range | 22.5% | 13.0% |
| Mean | 7.0% | 6.8% |
| Median | 6.5% | 7.0% |
| Interquartile 25% (IQ1) | 5.3% | 5.0% |
| Interquartile 75% (IQ3) | 7.3% | 8.3% |
| Interquartile Range (IQR) | 2.0% | 3.3% |
| Standard Deviation (Sample) | 3.9% | 3.0% |
| Standard Deviation (Population) | 3.8% | 2.9% |
Similar Demographics by Disability Age 18 to 34
Demographics Similar to British West Indians by Disability Age 18 to 34
In terms of disability age 18 to 34, the demographic groups most similar to British West Indians are Peruvian (6.0%, a difference of 0.030%), Salvadoran (6.0%, a difference of 0.080%), Taiwanese (6.0%, a difference of 0.090%), Trinidadian and Tobagonian (6.0%, a difference of 0.23%), and Immigrants from Caribbean (6.0%, a difference of 0.26%).
| Demographics | Rating | Rank | Disability Age 18 to 34 |
| Immigrants | Malaysia | 99.7 /100 | #54 | Exceptional 5.9% |
| Immigrants | Spain | 99.7 /100 | #55 | Exceptional 5.9% |
| Paraguayans | 99.7 /100 | #56 | Exceptional 5.9% |
| Immigrants | Haiti | 99.7 /100 | #57 | Exceptional 5.9% |
| Immigrants | Serbia | 99.7 /100 | #58 | Exceptional 5.9% |
| Immigrants | Caribbean | 99.6 /100 | #59 | Exceptional 6.0% |
| Immigrants | Sri Lanka | 99.6 /100 | #60 | Exceptional 6.0% |
| British West Indians | 99.6 /100 | #61 | Exceptional 6.0% |
| Peruvians | 99.6 /100 | #62 | Exceptional 6.0% |
| Salvadorans | 99.6 /100 | #63 | Exceptional 6.0% |
| Taiwanese | 99.6 /100 | #64 | Exceptional 6.0% |
| Trinidadians and Tobagonians | 99.5 /100 | #65 | Exceptional 6.0% |
| Burmese | 99.5 /100 | #66 | Exceptional 6.0% |
| Immigrants | North Macedonia | 99.5 /100 | #67 | Exceptional 6.0% |
| Immigrants | Poland | 99.5 /100 | #68 | Exceptional 6.0% |
Demographics Similar to Liberians by Disability Age 18 to 34
In terms of disability age 18 to 34, the demographic groups most similar to Liberians are Austrian (7.1%, a difference of 0.17%), Marshallese (7.1%, a difference of 0.22%), Subsaharan African (7.1%, a difference of 0.25%), Italian (7.1%, a difference of 0.33%), and Arapaho (7.1%, a difference of 0.45%).
| Demographics | Rating | Rank | Disability Age 18 to 34 |
| Lithuanians | 4.1 /100 | #229 | Tragic 7.0% |
| Immigrants | North America | 3.9 /100 | #230 | Tragic 7.0% |
| Ute | 3.8 /100 | #231 | Tragic 7.0% |
| Samoans | 3.2 /100 | #232 | Tragic 7.0% |
| New Zealanders | 2.7 /100 | #233 | Tragic 7.0% |
| Alsatians | 2.1 /100 | #234 | Tragic 7.0% |
| Sub-Saharan Africans | 1.7 /100 | #235 | Tragic 7.1% |
| Liberians | 1.5 /100 | #236 | Tragic 7.1% |
| Austrians | 1.3 /100 | #237 | Tragic 7.1% |
| Marshallese | 1.3 /100 | #238 | Tragic 7.1% |
| Italians | 1.2 /100 | #239 | Tragic 7.1% |
| Arapaho | 1.1 /100 | #240 | Tragic 7.1% |
| Nepalese | 1.1 /100 | #241 | Tragic 7.1% |
| Immigrants | Congo | 1.1 /100 | #242 | Tragic 7.1% |
| Icelanders | 1.0 /100 | #243 | Tragic 7.1% |