Indonesian vs Liberian Disability Age 18 to 34
COMPARE
Indonesian
Liberian
Disability Age 18 to 34
Disability Age 18 to 34 Comparison
Indonesians
Liberians
7.2%
DISABILITY AGE 18 TO 34
0.4/ 100
METRIC RATING
254th/ 347
METRIC RANK
7.1%
DISABILITY AGE 18 TO 34
1.5/ 100
METRIC RATING
236th/ 347
METRIC RANK
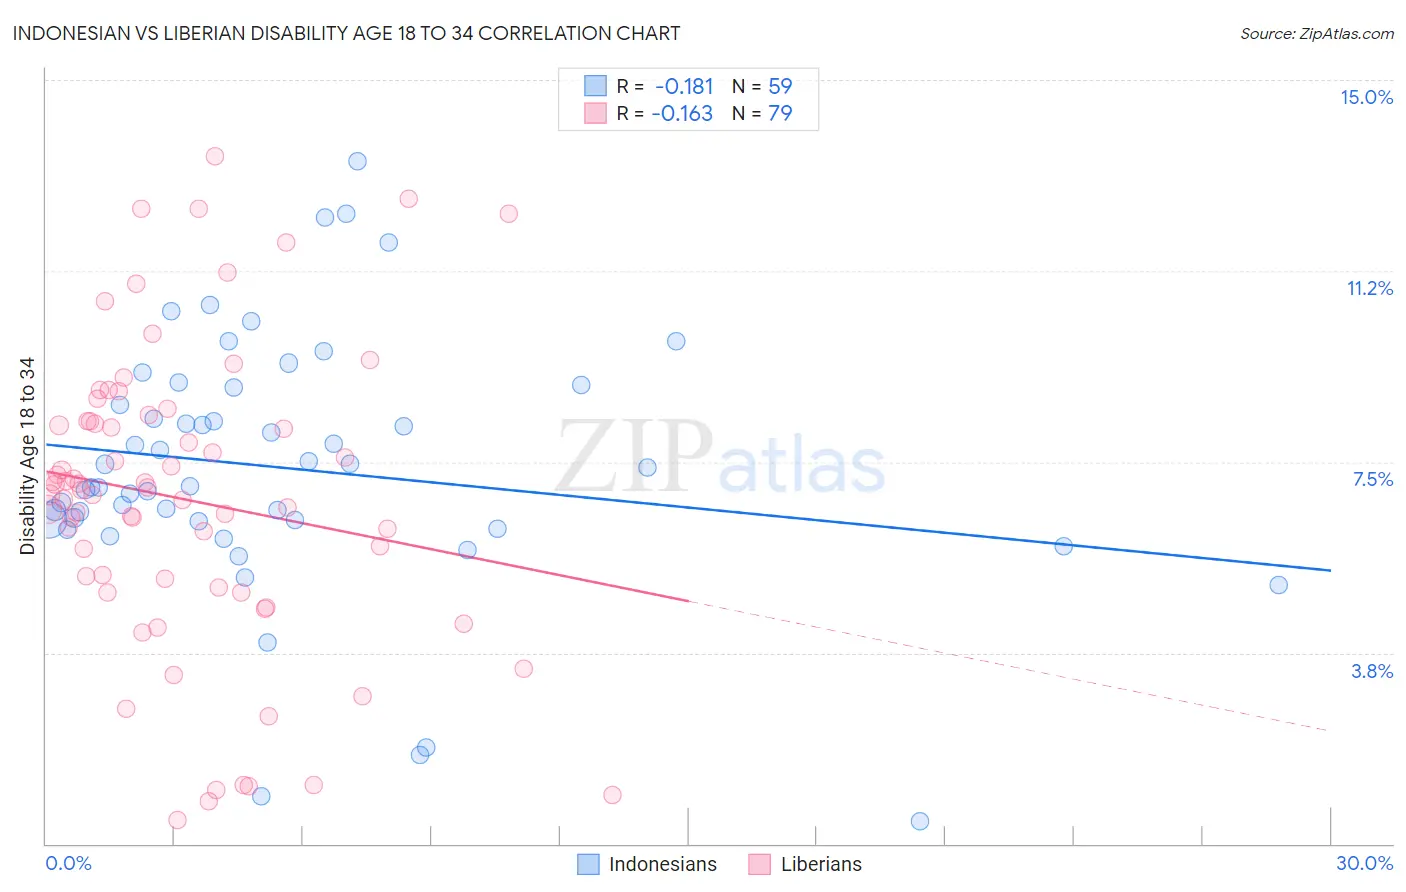
Indonesian vs Liberian Disability Age 18 to 34 Correlation Chart
The statistical analysis conducted on geographies consisting of 162,691,406 people shows a poor negative correlation between the proportion of Indonesians and percentage of population with a disability between the ages 18 and 35 in the United States with a correlation coefficient (R) of -0.181 and weighted average of 7.2%. Similarly, the statistical analysis conducted on geographies consisting of 118,043,713 people shows a poor negative correlation between the proportion of Liberians and percentage of population with a disability between the ages 18 and 35 in the United States with a correlation coefficient (R) of -0.163 and weighted average of 7.1%, a difference of 2.1%.
Disability Age 18 to 34 Correlation Summary
| Measurement | Indonesian | Liberian |
| Minimum | 0.44% | 0.47% |
| Maximum | 13.4% | 13.5% |
| Range | 13.0% | 13.0% |
| Mean | 7.4% | 6.8% |
| Median | 7.0% | 7.0% |
| Interquartile 25% (IQ1) | 6.3% | 5.0% |
| Interquartile 75% (IQ3) | 9.0% | 8.3% |
| Interquartile Range (IQR) | 2.6% | 3.3% |
| Standard Deviation (Sample) | 2.5% | 3.0% |
| Standard Deviation (Population) | 2.5% | 2.9% |
Demographics Similar to Indonesians and Liberians by Disability Age 18 to 34
In terms of disability age 18 to 34, the demographic groups most similar to Indonesians are Immigrants from Germany (7.2%, a difference of 0.020%), Croatian (7.2%, a difference of 0.29%), Polish (7.2%, a difference of 0.55%), Spaniard (7.2%, a difference of 0.57%), and Fijian (7.2%, a difference of 0.59%). Similarly, the demographic groups most similar to Liberians are Austrian (7.1%, a difference of 0.17%), Marshallese (7.1%, a difference of 0.22%), Subsaharan African (7.1%, a difference of 0.25%), Italian (7.1%, a difference of 0.33%), and Arapaho (7.1%, a difference of 0.45%).
| Demographics | Rating | Rank | Disability Age 18 to 34 |
| Sub-Saharan Africans | 1.7 /100 | #235 | Tragic 7.1% |
| Liberians | 1.5 /100 | #236 | Tragic 7.1% |
| Austrians | 1.3 /100 | #237 | Tragic 7.1% |
| Marshallese | 1.3 /100 | #238 | Tragic 7.1% |
| Italians | 1.2 /100 | #239 | Tragic 7.1% |
| Arapaho | 1.1 /100 | #240 | Tragic 7.1% |
| Nepalese | 1.1 /100 | #241 | Tragic 7.1% |
| Immigrants | Congo | 1.1 /100 | #242 | Tragic 7.1% |
| Icelanders | 1.0 /100 | #243 | Tragic 7.1% |
| Immigrants | Zaire | 0.9 /100 | #244 | Tragic 7.1% |
| Hungarians | 0.9 /100 | #245 | Tragic 7.1% |
| Immigrants | Liberia | 0.8 /100 | #246 | Tragic 7.1% |
| Yugoslavians | 0.8 /100 | #247 | Tragic 7.2% |
| Guamanians/Chamorros | 0.8 /100 | #248 | Tragic 7.2% |
| Malaysians | 0.7 /100 | #249 | Tragic 7.2% |
| Fijians | 0.6 /100 | #250 | Tragic 7.2% |
| Spaniards | 0.6 /100 | #251 | Tragic 7.2% |
| Poles | 0.6 /100 | #252 | Tragic 7.2% |
| Croatians | 0.5 /100 | #253 | Tragic 7.2% |
| Indonesians | 0.4 /100 | #254 | Tragic 7.2% |
| Immigrants | Germany | 0.4 /100 | #255 | Tragic 7.2% |