Scotch-Irish vs Liberian 2 or more Vehicles in Household
COMPARE
Scotch-Irish
Liberian
2 or more Vehicles in Household
2 or more Vehicles in Household Comparison
Scotch-Irish
Liberians
60.9%
2 OR MORE VEHICLES IN HOUSEHOLD
100.0/ 100
METRIC RATING
23rd/ 347
METRIC RANK
51.7%
2 OR MORE VEHICLES IN HOUSEHOLD
0.1/ 100
METRIC RATING
279th/ 347
METRIC RANK
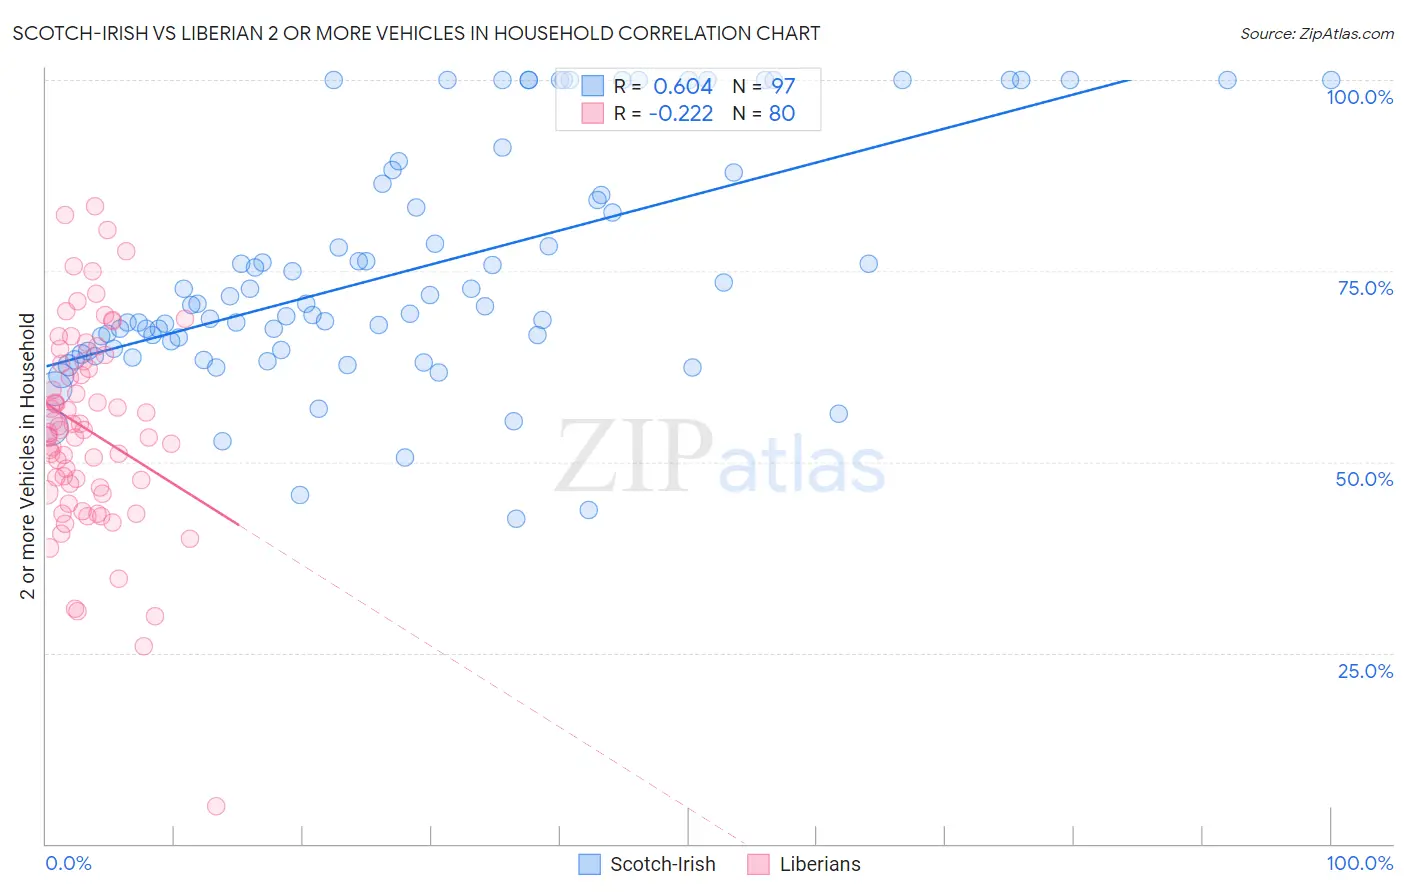
Scotch-Irish vs Liberian 2 or more Vehicles in Household Correlation Chart
The statistical analysis conducted on geographies consisting of 548,429,166 people shows a significant positive correlation between the proportion of Scotch-Irish and percentage of households with 2 or more vehicles available in the United States with a correlation coefficient (R) of 0.604 and weighted average of 60.9%. Similarly, the statistical analysis conducted on geographies consisting of 118,047,251 people shows a weak negative correlation between the proportion of Liberians and percentage of households with 2 or more vehicles available in the United States with a correlation coefficient (R) of -0.222 and weighted average of 51.7%, a difference of 17.8%.
2 or more Vehicles in Household Correlation Summary
| Measurement | Scotch-Irish | Liberian |
| Minimum | 42.5% | 4.9% |
| Maximum | 100.0% | 83.5% |
| Range | 57.5% | 78.6% |
| Mean | 75.1% | 54.2% |
| Median | 70.6% | 54.0% |
| Interquartile 25% (IQ1) | 64.5% | 46.3% |
| Interquartile 75% (IQ3) | 87.2% | 63.0% |
| Interquartile Range (IQR) | 22.6% | 16.7% |
| Standard Deviation (Sample) | 15.5% | 13.4% |
| Standard Deviation (Population) | 15.4% | 13.3% |
Similar Demographics by 2 or more Vehicles in Household
Demographics Similar to Scotch-Irish by 2 or more Vehicles in Household
In terms of 2 or more vehicles in household, the demographic groups most similar to Scotch-Irish are Swiss (61.0%, a difference of 0.040%), Immigrants from Vietnam (60.9%, a difference of 0.040%), Korean (61.0%, a difference of 0.070%), Sri Lankan (61.0%, a difference of 0.12%), and White/Caucasian (60.8%, a difference of 0.19%).
| Demographics | Rating | Rank | 2 or more Vehicles in Household |
| Native Hawaiians | 100.0 /100 | #16 | Exceptional 61.4% |
| Basques | 100.0 /100 | #17 | Exceptional 61.4% |
| Europeans | 100.0 /100 | #18 | Exceptional 61.4% |
| Scottish | 100.0 /100 | #19 | Exceptional 61.2% |
| Sri Lankans | 100.0 /100 | #20 | Exceptional 61.0% |
| Koreans | 100.0 /100 | #21 | Exceptional 61.0% |
| Swiss | 100.0 /100 | #22 | Exceptional 61.0% |
| Scotch-Irish | 100.0 /100 | #23 | Exceptional 60.9% |
| Immigrants | Vietnam | 100.0 /100 | #24 | Exceptional 60.9% |
| Whites/Caucasians | 100.0 /100 | #25 | Exceptional 60.8% |
| Welsh | 100.0 /100 | #26 | Exceptional 60.8% |
| Assyrians/Chaldeans/Syriacs | 100.0 /100 | #27 | Exceptional 60.5% |
| Guamanians/Chamorros | 100.0 /100 | #28 | Exceptional 60.5% |
| Hawaiians | 100.0 /100 | #29 | Exceptional 60.4% |
| Finns | 100.0 /100 | #30 | Exceptional 60.3% |
Demographics Similar to Liberians by 2 or more Vehicles in Household
In terms of 2 or more vehicles in household, the demographic groups most similar to Liberians are Yuman (51.7%, a difference of 0.010%), Immigrants from Eastern Europe (51.7%, a difference of 0.030%), Immigrants from Africa (51.8%, a difference of 0.070%), Immigrants from Croatia (51.8%, a difference of 0.13%), and Immigrants from Honduras (51.8%, a difference of 0.15%).
| Demographics | Rating | Rank | 2 or more Vehicles in Household |
| Sub-Saharan Africans | 0.2 /100 | #272 | Tragic 51.9% |
| Israelis | 0.2 /100 | #273 | Tragic 51.9% |
| Africans | 0.2 /100 | #274 | Tragic 51.8% |
| Immigrants | Honduras | 0.2 /100 | #275 | Tragic 51.8% |
| Immigrants | Croatia | 0.2 /100 | #276 | Tragic 51.8% |
| Immigrants | Africa | 0.2 /100 | #277 | Tragic 51.8% |
| Yuman | 0.1 /100 | #278 | Tragic 51.7% |
| Liberians | 0.1 /100 | #279 | Tragic 51.7% |
| Immigrants | Eastern Europe | 0.1 /100 | #280 | Tragic 51.7% |
| Immigrants | Kazakhstan | 0.1 /100 | #281 | Tragic 51.6% |
| Bahamians | 0.1 /100 | #282 | Tragic 51.5% |
| Immigrants | China | 0.1 /100 | #283 | Tragic 51.5% |
| Immigrants | Zaire | 0.1 /100 | #284 | Tragic 51.5% |
| Immigrants | Uruguay | 0.1 /100 | #285 | Tragic 51.4% |
| Immigrants | Liberia | 0.1 /100 | #286 | Tragic 51.3% |