Scotch-Irish vs Immigrants from Western Asia Self-Care Disability
COMPARE
Scotch-Irish
Immigrants from Western Asia
Self-Care Disability
Self-Care Disability Comparison
Scotch-Irish
Immigrants from Western Asia
2.6%
SELF-CARE DISABILITY
4.1/ 100
METRIC RATING
218th/ 347
METRIC RANK
2.6%
SELF-CARE DISABILITY
0.6/ 100
METRIC RATING
245th/ 347
METRIC RANK
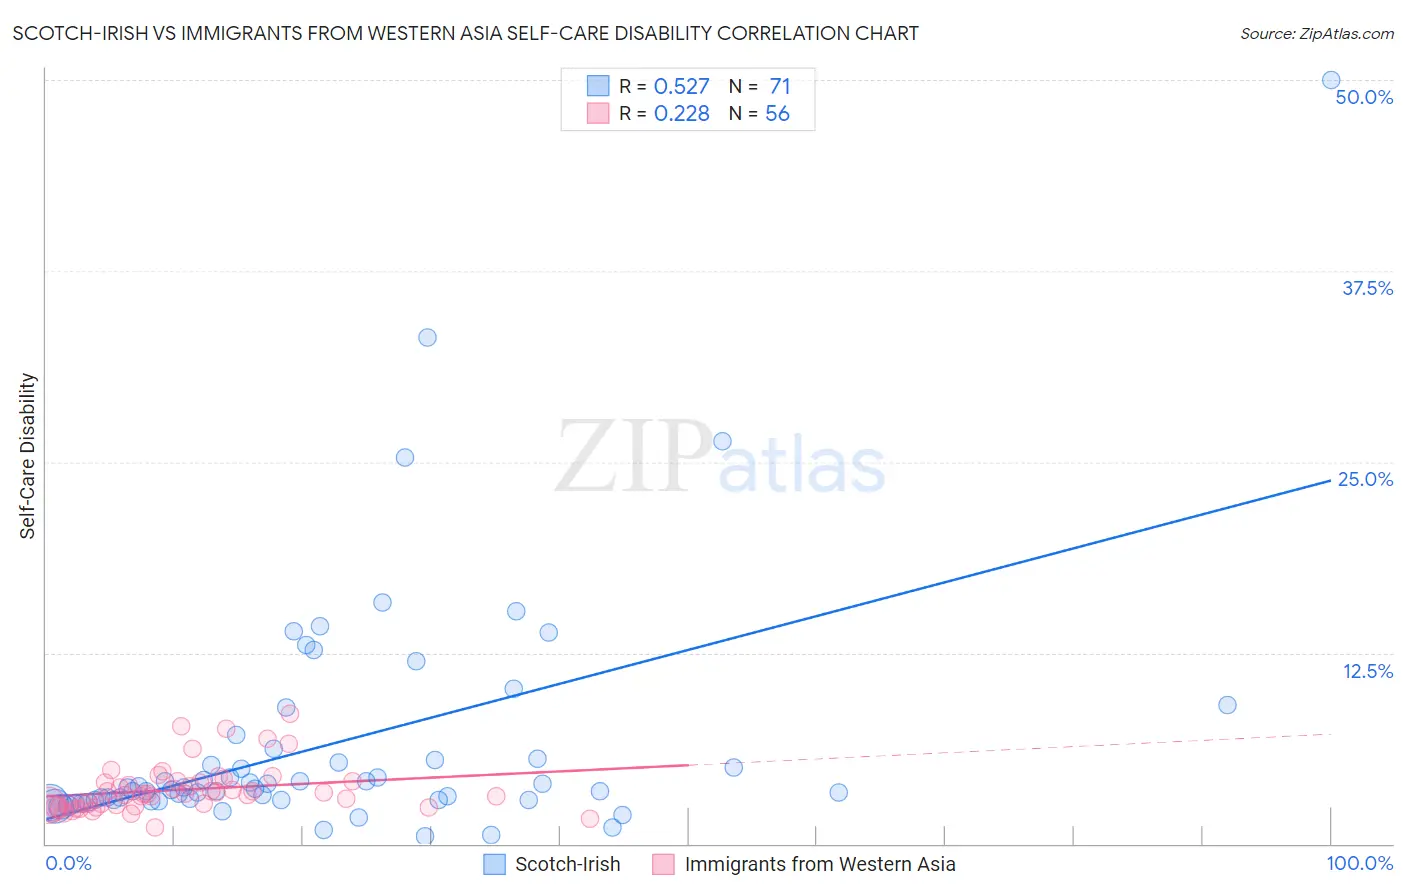
Scotch-Irish vs Immigrants from Western Asia Self-Care Disability Correlation Chart
The statistical analysis conducted on geographies consisting of 547,085,910 people shows a substantial positive correlation between the proportion of Scotch-Irish and percentage of population with self-care disability in the United States with a correlation coefficient (R) of 0.527 and weighted average of 2.6%. Similarly, the statistical analysis conducted on geographies consisting of 403,944,060 people shows a weak positive correlation between the proportion of Immigrants from Western Asia and percentage of population with self-care disability in the United States with a correlation coefficient (R) of 0.228 and weighted average of 2.6%, a difference of 2.2%.
Self-Care Disability Correlation Summary
| Measurement | Scotch-Irish | Immigrants from Western Asia |
| Minimum | 0.47% | 1.1% |
| Maximum | 50.0% | 8.5% |
| Range | 49.5% | 7.4% |
| Mean | 6.5% | 3.5% |
| Median | 3.6% | 3.3% |
| Interquartile 25% (IQ1) | 2.8% | 2.5% |
| Interquartile 75% (IQ3) | 5.6% | 4.0% |
| Interquartile Range (IQR) | 2.7% | 1.5% |
| Standard Deviation (Sample) | 8.0% | 1.5% |
| Standard Deviation (Population) | 7.9% | 1.5% |
Similar Demographics by Self-Care Disability
Demographics Similar to Scotch-Irish by Self-Care Disability
In terms of self-care disability, the demographic groups most similar to Scotch-Irish are Immigrants from Moldova (2.6%, a difference of 0.030%), Subsaharan African (2.6%, a difference of 0.040%), Celtic (2.6%, a difference of 0.070%), Honduran (2.6%, a difference of 0.080%), and White/Caucasian (2.6%, a difference of 0.090%).
| Demographics | Rating | Rank | Self-Care Disability |
| Native Hawaiians | 5.1 /100 | #211 | Tragic 2.6% |
| Samoans | 5.1 /100 | #212 | Tragic 2.6% |
| Ecuadorians | 4.7 /100 | #213 | Tragic 2.6% |
| Immigrants | Honduras | 4.7 /100 | #214 | Tragic 2.6% |
| Immigrants | Thailand | 4.5 /100 | #215 | Tragic 2.6% |
| Whites/Caucasians | 4.4 /100 | #216 | Tragic 2.6% |
| Celtics | 4.4 /100 | #217 | Tragic 2.6% |
| Scotch-Irish | 4.1 /100 | #218 | Tragic 2.6% |
| Immigrants | Moldova | 4.0 /100 | #219 | Tragic 2.6% |
| Sub-Saharan Africans | 4.0 /100 | #220 | Tragic 2.6% |
| Hondurans | 3.8 /100 | #221 | Tragic 2.6% |
| Spaniards | 3.8 /100 | #222 | Tragic 2.6% |
| French Canadians | 3.8 /100 | #223 | Tragic 2.6% |
| Osage | 3.6 /100 | #224 | Tragic 2.6% |
| Iraqis | 3.2 /100 | #225 | Tragic 2.6% |
Demographics Similar to Immigrants from Western Asia by Self-Care Disability
In terms of self-care disability, the demographic groups most similar to Immigrants from Western Asia are Cheyenne (2.6%, a difference of 0.020%), Immigrants from Albania (2.6%, a difference of 0.15%), Nicaraguan (2.6%, a difference of 0.15%), Yuman (2.6%, a difference of 0.19%), and Hawaiian (2.6%, a difference of 0.23%).
| Demographics | Rating | Rank | Self-Care Disability |
| Senegalese | 1.3 /100 | #238 | Tragic 2.6% |
| Immigrants | Panama | 1.2 /100 | #239 | Tragic 2.6% |
| Marshallese | 1.2 /100 | #240 | Tragic 2.6% |
| Immigrants | Syria | 1.0 /100 | #241 | Tragic 2.6% |
| Spanish | 0.8 /100 | #242 | Tragic 2.6% |
| Hawaiians | 0.8 /100 | #243 | Tragic 2.6% |
| Yuman | 0.8 /100 | #244 | Tragic 2.6% |
| Immigrants | Western Asia | 0.6 /100 | #245 | Tragic 2.6% |
| Cheyenne | 0.6 /100 | #246 | Tragic 2.6% |
| Immigrants | Albania | 0.6 /100 | #247 | Tragic 2.6% |
| Nicaraguans | 0.6 /100 | #248 | Tragic 2.6% |
| Mexican American Indians | 0.5 /100 | #249 | Tragic 2.6% |
| Portuguese | 0.4 /100 | #250 | Tragic 2.6% |
| Immigrants | Liberia | 0.4 /100 | #251 | Tragic 2.6% |
| Immigrants | Bangladesh | 0.4 /100 | #252 | Tragic 2.6% |