Scotch-Irish vs Immigrants from Jamaica Self-Care Disability
COMPARE
Scotch-Irish
Immigrants from Jamaica
Self-Care Disability
Self-Care Disability Comparison
Scotch-Irish
Immigrants from Jamaica
2.6%
SELF-CARE DISABILITY
4.1/ 100
METRIC RATING
218th/ 347
METRIC RANK
2.7%
SELF-CARE DISABILITY
0.0/ 100
METRIC RATING
287th/ 347
METRIC RANK
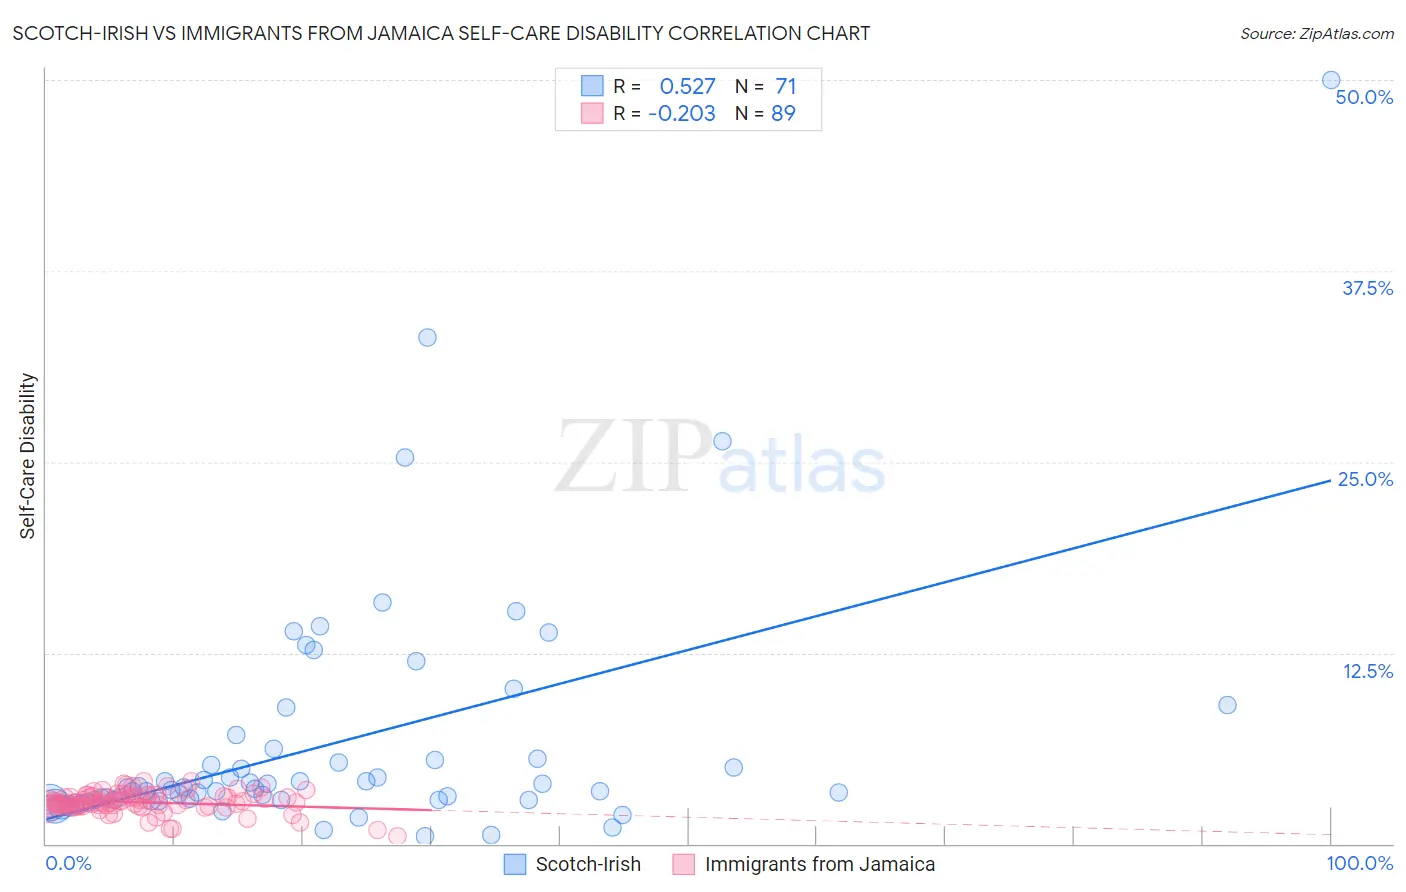
Scotch-Irish vs Immigrants from Jamaica Self-Care Disability Correlation Chart
The statistical analysis conducted on geographies consisting of 547,085,910 people shows a substantial positive correlation between the proportion of Scotch-Irish and percentage of population with self-care disability in the United States with a correlation coefficient (R) of 0.527 and weighted average of 2.6%. Similarly, the statistical analysis conducted on geographies consisting of 301,430,789 people shows a weak negative correlation between the proportion of Immigrants from Jamaica and percentage of population with self-care disability in the United States with a correlation coefficient (R) of -0.203 and weighted average of 2.7%, a difference of 6.4%.
Self-Care Disability Correlation Summary
| Measurement | Scotch-Irish | Immigrants from Jamaica |
| Minimum | 0.47% | 0.47% |
| Maximum | 50.0% | 4.1% |
| Range | 49.5% | 3.7% |
| Mean | 6.5% | 2.7% |
| Median | 3.6% | 2.7% |
| Interquartile 25% (IQ1) | 2.8% | 2.5% |
| Interquartile 75% (IQ3) | 5.6% | 3.1% |
| Interquartile Range (IQR) | 2.7% | 0.64% |
| Standard Deviation (Sample) | 8.0% | 0.68% |
| Standard Deviation (Population) | 7.9% | 0.68% |
Similar Demographics by Self-Care Disability
Demographics Similar to Scotch-Irish by Self-Care Disability
In terms of self-care disability, the demographic groups most similar to Scotch-Irish are Immigrants from Moldova (2.6%, a difference of 0.030%), Subsaharan African (2.6%, a difference of 0.040%), Celtic (2.6%, a difference of 0.070%), Honduran (2.6%, a difference of 0.080%), and White/Caucasian (2.6%, a difference of 0.090%).
| Demographics | Rating | Rank | Self-Care Disability |
| Native Hawaiians | 5.1 /100 | #211 | Tragic 2.6% |
| Samoans | 5.1 /100 | #212 | Tragic 2.6% |
| Ecuadorians | 4.7 /100 | #213 | Tragic 2.6% |
| Immigrants | Honduras | 4.7 /100 | #214 | Tragic 2.6% |
| Immigrants | Thailand | 4.5 /100 | #215 | Tragic 2.6% |
| Whites/Caucasians | 4.4 /100 | #216 | Tragic 2.6% |
| Celtics | 4.4 /100 | #217 | Tragic 2.6% |
| Scotch-Irish | 4.1 /100 | #218 | Tragic 2.6% |
| Immigrants | Moldova | 4.0 /100 | #219 | Tragic 2.6% |
| Sub-Saharan Africans | 4.0 /100 | #220 | Tragic 2.6% |
| Hondurans | 3.8 /100 | #221 | Tragic 2.6% |
| Spaniards | 3.8 /100 | #222 | Tragic 2.6% |
| French Canadians | 3.8 /100 | #223 | Tragic 2.6% |
| Osage | 3.6 /100 | #224 | Tragic 2.6% |
| Iraqis | 3.2 /100 | #225 | Tragic 2.6% |
Demographics Similar to Immigrants from Jamaica by Self-Care Disability
In terms of self-care disability, the demographic groups most similar to Immigrants from Jamaica are Immigrants from Barbados (2.7%, a difference of 0.030%), African (2.7%, a difference of 0.14%), Cuban (2.7%, a difference of 0.29%), French American Indian (2.7%, a difference of 0.33%), and Guyanese (2.7%, a difference of 0.55%).
| Demographics | Rating | Rank | Self-Care Disability |
| Hispanics or Latinos | 0.1 /100 | #280 | Tragic 2.7% |
| Immigrants | Iraq | 0.0 /100 | #281 | Tragic 2.7% |
| Apache | 0.0 /100 | #282 | Tragic 2.7% |
| Delaware | 0.0 /100 | #283 | Tragic 2.7% |
| Fijians | 0.0 /100 | #284 | Tragic 2.7% |
| Jamaicans | 0.0 /100 | #285 | Tragic 2.7% |
| French American Indians | 0.0 /100 | #286 | Tragic 2.7% |
| Immigrants | Jamaica | 0.0 /100 | #287 | Tragic 2.7% |
| Immigrants | Barbados | 0.0 /100 | #288 | Tragic 2.7% |
| Africans | 0.0 /100 | #289 | Tragic 2.7% |
| Cubans | 0.0 /100 | #290 | Tragic 2.7% |
| Guyanese | 0.0 /100 | #291 | Tragic 2.7% |
| Central American Indians | 0.0 /100 | #292 | Tragic 2.7% |
| Belizeans | 0.0 /100 | #293 | Tragic 2.7% |
| Blackfeet | 0.0 /100 | #294 | Tragic 2.7% |