Scotch-Irish vs Immigrants from Western Asia Average Family Size
COMPARE
Scotch-Irish
Immigrants from Western Asia
Average Family Size
Average Family Size Comparison
Scotch-Irish
Immigrants from Western Asia
3.11
AVERAGE FAMILY SIZE
0.0/ 100
METRIC RATING
331st/ 347
METRIC RANK
3.26
AVERAGE FAMILY SIZE
87.7/ 100
METRIC RATING
131st/ 347
METRIC RANK
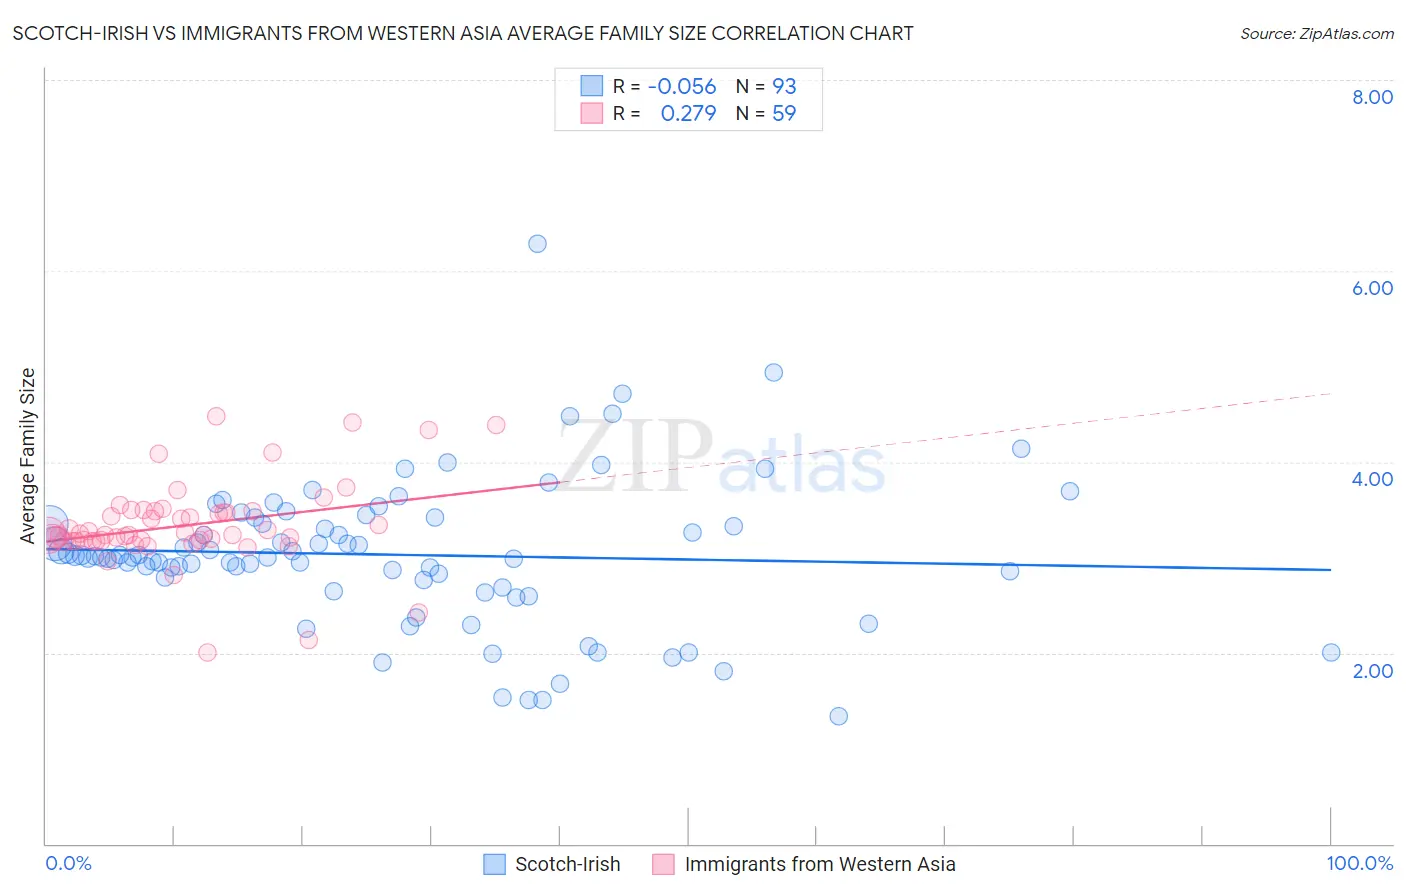
Scotch-Irish vs Immigrants from Western Asia Average Family Size Correlation Chart
The statistical analysis conducted on geographies consisting of 548,372,805 people shows a slight negative correlation between the proportion of Scotch-Irish and average family size in the United States with a correlation coefficient (R) of -0.056 and weighted average of 3.11. Similarly, the statistical analysis conducted on geographies consisting of 404,181,617 people shows a weak positive correlation between the proportion of Immigrants from Western Asia and average family size in the United States with a correlation coefficient (R) of 0.279 and weighted average of 3.26, a difference of 4.9%.
Average Family Size Correlation Summary
| Measurement | Scotch-Irish | Immigrants from Western Asia |
| Minimum | 1.34 | 2.00 |
| Maximum | 6.29 | 4.47 |
| Range | 4.95 | 2.47 |
| Mean | 3.03 | 3.33 |
| Median | 3.00 | 3.23 |
| Interquartile 25% (IQ1) | 2.73 | 3.17 |
| Interquartile 75% (IQ3) | 3.38 | 3.48 |
| Interquartile Range (IQR) | 0.65 | 0.30 |
| Standard Deviation (Sample) | 0.77 | 0.44 |
| Standard Deviation (Population) | 0.77 | 0.44 |
Similar Demographics by Average Family Size
Demographics Similar to Scotch-Irish by Average Family Size
In terms of average family size, the demographic groups most similar to Scotch-Irish are Latvian (3.11, a difference of 0.0%), Scottish (3.11, a difference of 0.0%), Estonian (3.10, a difference of 0.050%), Lithuanian (3.10, a difference of 0.050%), and Belgian (3.11, a difference of 0.060%).
| Demographics | Rating | Rank | Average Family Size |
| Celtics | 0.0 /100 | #324 | Tragic 3.11 |
| English | 0.0 /100 | #325 | Tragic 3.11 |
| Ottawa | 0.0 /100 | #326 | Tragic 3.11 |
| Dutch | 0.0 /100 | #327 | Tragic 3.11 |
| Czechs | 0.0 /100 | #328 | Tragic 3.11 |
| Belgians | 0.0 /100 | #329 | Tragic 3.11 |
| Latvians | 0.0 /100 | #330 | Tragic 3.11 |
| Scotch-Irish | 0.0 /100 | #331 | Tragic 3.11 |
| Scottish | 0.0 /100 | #332 | Tragic 3.11 |
| Estonians | 0.0 /100 | #333 | Tragic 3.10 |
| Lithuanians | 0.0 /100 | #334 | Tragic 3.10 |
| Luxembourgers | 0.0 /100 | #335 | Tragic 3.10 |
| Irish | 0.0 /100 | #336 | Tragic 3.10 |
| Swedes | 0.0 /100 | #337 | Tragic 3.10 |
| French | 0.0 /100 | #338 | Tragic 3.10 |
Demographics Similar to Immigrants from Western Asia by Average Family Size
In terms of average family size, the demographic groups most similar to Immigrants from Western Asia are Laotian (3.26, a difference of 0.030%), Immigrants from Hong Kong (3.26, a difference of 0.040%), Costa Rican (3.26, a difference of 0.040%), Immigrants from Venezuela (3.26, a difference of 0.060%), and Colombian (3.26, a difference of 0.10%).
| Demographics | Rating | Rank | Average Family Size |
| South American Indians | 91.6 /100 | #124 | Exceptional 3.26 |
| Immigrants | Cuba | 91.3 /100 | #125 | Exceptional 3.26 |
| Immigrants | Costa Rica | 90.7 /100 | #126 | Exceptional 3.26 |
| Immigrants | Syria | 90.6 /100 | #127 | Exceptional 3.26 |
| Colombians | 89.9 /100 | #128 | Excellent 3.26 |
| Immigrants | Hong Kong | 88.6 /100 | #129 | Excellent 3.26 |
| Laotians | 88.5 /100 | #130 | Excellent 3.26 |
| Immigrants | Western Asia | 87.7 /100 | #131 | Excellent 3.26 |
| Costa Ricans | 86.8 /100 | #132 | Excellent 3.26 |
| Immigrants | Venezuela | 86.3 /100 | #133 | Excellent 3.26 |
| Africans | 84.9 /100 | #134 | Excellent 3.25 |
| Panamanians | 84.2 /100 | #135 | Excellent 3.25 |
| Comanche | 82.8 /100 | #136 | Excellent 3.25 |
| Immigrants | Middle Africa | 82.4 /100 | #137 | Excellent 3.25 |
| Cubans | 81.8 /100 | #138 | Excellent 3.25 |