Immigrants from Nepal vs Immigrants from Western Asia Self-Care Disability
COMPARE
Immigrants from Nepal
Immigrants from Western Asia
Self-Care Disability
Self-Care Disability Comparison
Immigrants from Nepal
Immigrants from Western Asia
2.2%
SELF-CARE DISABILITY
100.0/ 100
METRIC RATING
9th/ 347
METRIC RANK
2.6%
SELF-CARE DISABILITY
0.6/ 100
METRIC RATING
245th/ 347
METRIC RANK
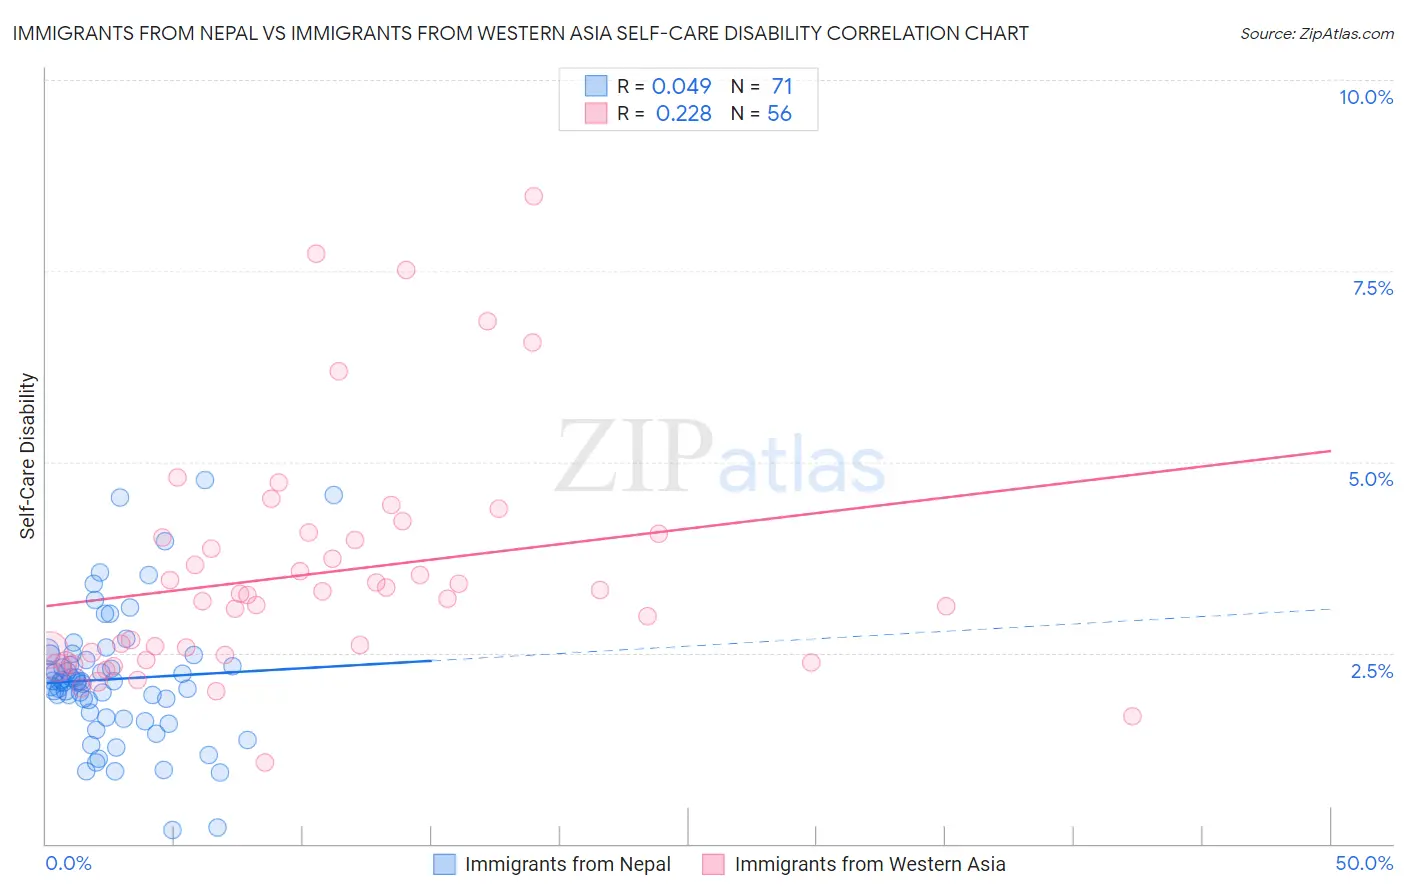
Immigrants from Nepal vs Immigrants from Western Asia Self-Care Disability Correlation Chart
The statistical analysis conducted on geographies consisting of 186,625,467 people shows no correlation between the proportion of Immigrants from Nepal and percentage of population with self-care disability in the United States with a correlation coefficient (R) of 0.049 and weighted average of 2.2%. Similarly, the statistical analysis conducted on geographies consisting of 403,944,060 people shows a weak positive correlation between the proportion of Immigrants from Western Asia and percentage of population with self-care disability in the United States with a correlation coefficient (R) of 0.228 and weighted average of 2.6%, a difference of 20.8%.
Self-Care Disability Correlation Summary
| Measurement | Immigrants from Nepal | Immigrants from Western Asia |
| Minimum | 0.19% | 1.1% |
| Maximum | 4.8% | 8.5% |
| Range | 4.6% | 7.4% |
| Mean | 2.2% | 3.5% |
| Median | 2.1% | 3.3% |
| Interquartile 25% (IQ1) | 1.7% | 2.5% |
| Interquartile 75% (IQ3) | 2.5% | 4.0% |
| Interquartile Range (IQR) | 0.82% | 1.5% |
| Standard Deviation (Sample) | 0.87% | 1.5% |
| Standard Deviation (Population) | 0.87% | 1.5% |
Similar Demographics by Self-Care Disability
Demographics Similar to Immigrants from Nepal by Self-Care Disability
In terms of self-care disability, the demographic groups most similar to Immigrants from Nepal are Bolivian (2.2%, a difference of 0.14%), Immigrants from Bolivia (2.2%, a difference of 0.18%), Filipino (2.2%, a difference of 0.39%), Zimbabwean (2.2%, a difference of 0.64%), and Sudanese (2.2%, a difference of 1.2%).
| Demographics | Rating | Rank | Self-Care Disability |
| Immigrants | India | 100.0 /100 | #2 | Exceptional 2.0% |
| Thais | 100.0 /100 | #3 | Exceptional 2.1% |
| Immigrants | Singapore | 100.0 /100 | #4 | Exceptional 2.1% |
| Zimbabweans | 100.0 /100 | #5 | Exceptional 2.2% |
| Filipinos | 100.0 /100 | #6 | Exceptional 2.2% |
| Immigrants | Bolivia | 100.0 /100 | #7 | Exceptional 2.2% |
| Bolivians | 100.0 /100 | #8 | Exceptional 2.2% |
| Immigrants | Nepal | 100.0 /100 | #9 | Exceptional 2.2% |
| Sudanese | 100.0 /100 | #10 | Exceptional 2.2% |
| Immigrants | South Central Asia | 100.0 /100 | #11 | Exceptional 2.2% |
| Immigrants | Ethiopia | 100.0 /100 | #12 | Exceptional 2.2% |
| Ethiopians | 100.0 /100 | #13 | Exceptional 2.2% |
| Luxembourgers | 100.0 /100 | #14 | Exceptional 2.2% |
| Okinawans | 100.0 /100 | #15 | Exceptional 2.2% |
| Immigrants | Kuwait | 100.0 /100 | #16 | Exceptional 2.2% |
Demographics Similar to Immigrants from Western Asia by Self-Care Disability
In terms of self-care disability, the demographic groups most similar to Immigrants from Western Asia are Cheyenne (2.6%, a difference of 0.020%), Immigrants from Albania (2.6%, a difference of 0.15%), Nicaraguan (2.6%, a difference of 0.15%), Yuman (2.6%, a difference of 0.19%), and Hawaiian (2.6%, a difference of 0.23%).
| Demographics | Rating | Rank | Self-Care Disability |
| Senegalese | 1.3 /100 | #238 | Tragic 2.6% |
| Immigrants | Panama | 1.2 /100 | #239 | Tragic 2.6% |
| Marshallese | 1.2 /100 | #240 | Tragic 2.6% |
| Immigrants | Syria | 1.0 /100 | #241 | Tragic 2.6% |
| Spanish | 0.8 /100 | #242 | Tragic 2.6% |
| Hawaiians | 0.8 /100 | #243 | Tragic 2.6% |
| Yuman | 0.8 /100 | #244 | Tragic 2.6% |
| Immigrants | Western Asia | 0.6 /100 | #245 | Tragic 2.6% |
| Cheyenne | 0.6 /100 | #246 | Tragic 2.6% |
| Immigrants | Albania | 0.6 /100 | #247 | Tragic 2.6% |
| Nicaraguans | 0.6 /100 | #248 | Tragic 2.6% |
| Mexican American Indians | 0.5 /100 | #249 | Tragic 2.6% |
| Portuguese | 0.4 /100 | #250 | Tragic 2.6% |
| Immigrants | Liberia | 0.4 /100 | #251 | Tragic 2.6% |
| Immigrants | Bangladesh | 0.4 /100 | #252 | Tragic 2.6% |