Macedonian vs Immigrants from Western Asia Self-Care Disability
COMPARE
Macedonian
Immigrants from Western Asia
Self-Care Disability
Self-Care Disability Comparison
Macedonians
Immigrants from Western Asia
2.4%
SELF-CARE DISABILITY
96.9/ 100
METRIC RATING
94th/ 347
METRIC RANK
2.6%
SELF-CARE DISABILITY
0.6/ 100
METRIC RATING
245th/ 347
METRIC RANK
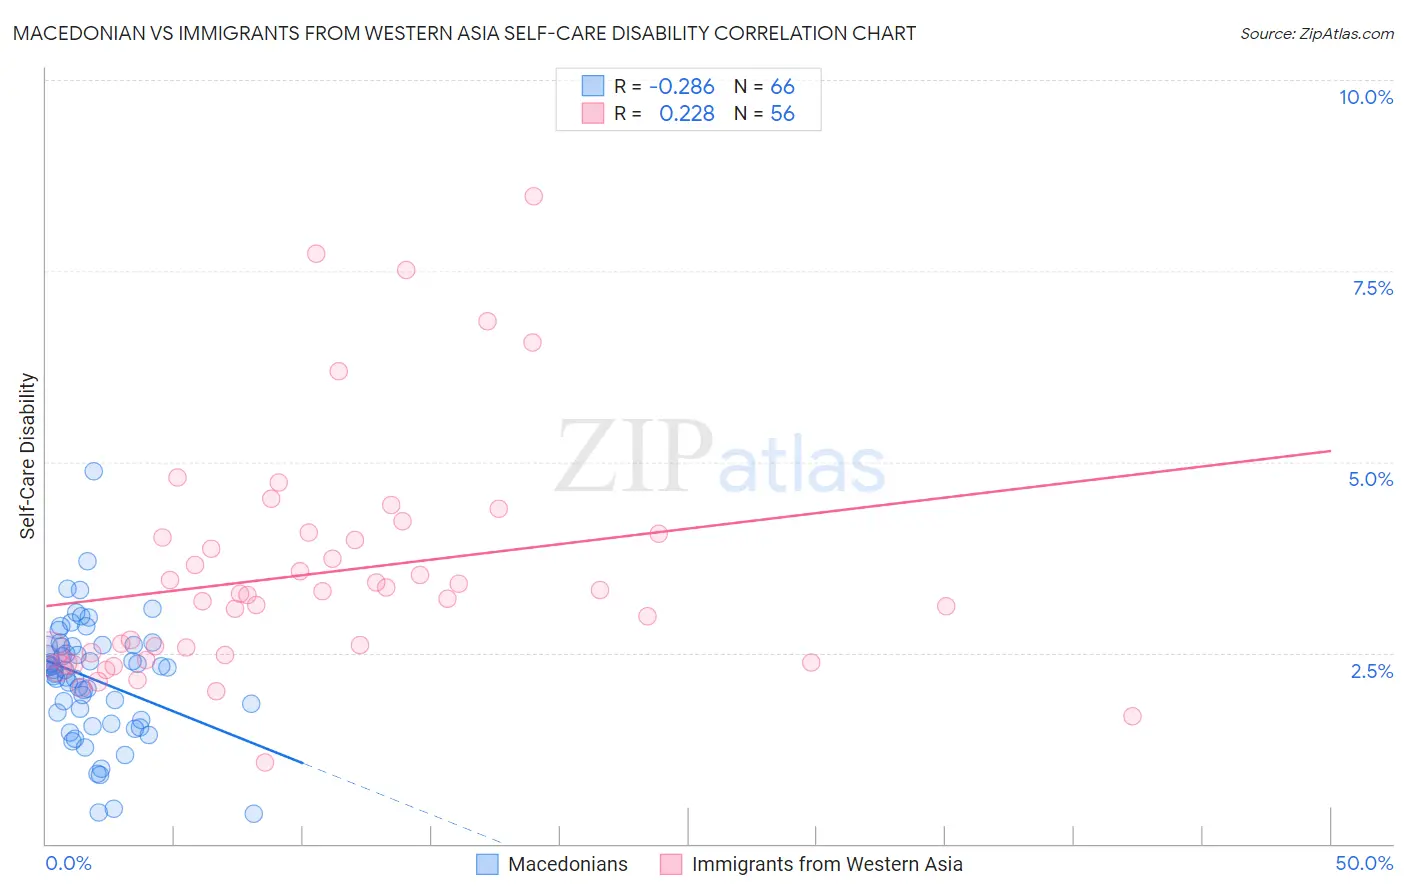
Macedonian vs Immigrants from Western Asia Self-Care Disability Correlation Chart
The statistical analysis conducted on geographies consisting of 132,583,440 people shows a weak negative correlation between the proportion of Macedonians and percentage of population with self-care disability in the United States with a correlation coefficient (R) of -0.286 and weighted average of 2.4%. Similarly, the statistical analysis conducted on geographies consisting of 403,944,060 people shows a weak positive correlation between the proportion of Immigrants from Western Asia and percentage of population with self-care disability in the United States with a correlation coefficient (R) of 0.228 and weighted average of 2.6%, a difference of 10.5%.
Self-Care Disability Correlation Summary
| Measurement | Macedonian | Immigrants from Western Asia |
| Minimum | 0.40% | 1.1% |
| Maximum | 4.9% | 8.5% |
| Range | 4.5% | 7.4% |
| Mean | 2.2% | 3.5% |
| Median | 2.3% | 3.3% |
| Interquartile 25% (IQ1) | 1.6% | 2.5% |
| Interquartile 75% (IQ3) | 2.6% | 4.0% |
| Interquartile Range (IQR) | 0.97% | 1.5% |
| Standard Deviation (Sample) | 0.78% | 1.5% |
| Standard Deviation (Population) | 0.78% | 1.5% |
Similar Demographics by Self-Care Disability
Demographics Similar to Macedonians by Self-Care Disability
In terms of self-care disability, the demographic groups most similar to Macedonians are Immigrants from Asia (2.4%, a difference of 0.010%), Immigrants from Latvia (2.4%, a difference of 0.040%), Immigrants from Chile (2.4%, a difference of 0.070%), Swiss (2.4%, a difference of 0.11%), and Immigrants from Poland (2.4%, a difference of 0.20%).
| Demographics | Rating | Rank | Self-Care Disability |
| Sierra Leoneans | 98.0 /100 | #87 | Exceptional 2.4% |
| Lithuanians | 98.0 /100 | #88 | Exceptional 2.4% |
| Immigrants | Congo | 98.0 /100 | #89 | Exceptional 2.4% |
| Immigrants | Czechoslovakia | 97.7 /100 | #90 | Exceptional 2.4% |
| Immigrants | Jordan | 97.7 /100 | #91 | Exceptional 2.4% |
| Icelanders | 97.4 /100 | #92 | Exceptional 2.4% |
| Immigrants | Latvia | 97.0 /100 | #93 | Exceptional 2.4% |
| Macedonians | 96.9 /100 | #94 | Exceptional 2.4% |
| Immigrants | Asia | 96.9 /100 | #95 | Exceptional 2.4% |
| Immigrants | Chile | 96.7 /100 | #96 | Exceptional 2.4% |
| Swiss | 96.6 /100 | #97 | Exceptional 2.4% |
| Immigrants | Poland | 96.4 /100 | #98 | Exceptional 2.4% |
| Immigrants | Israel | 96.1 /100 | #99 | Exceptional 2.4% |
| Europeans | 95.8 /100 | #100 | Exceptional 2.4% |
| Immigrants | Scotland | 95.7 /100 | #101 | Exceptional 2.4% |
Demographics Similar to Immigrants from Western Asia by Self-Care Disability
In terms of self-care disability, the demographic groups most similar to Immigrants from Western Asia are Cheyenne (2.6%, a difference of 0.020%), Immigrants from Albania (2.6%, a difference of 0.15%), Nicaraguan (2.6%, a difference of 0.15%), Yuman (2.6%, a difference of 0.19%), and Hawaiian (2.6%, a difference of 0.23%).
| Demographics | Rating | Rank | Self-Care Disability |
| Senegalese | 1.3 /100 | #238 | Tragic 2.6% |
| Immigrants | Panama | 1.2 /100 | #239 | Tragic 2.6% |
| Marshallese | 1.2 /100 | #240 | Tragic 2.6% |
| Immigrants | Syria | 1.0 /100 | #241 | Tragic 2.6% |
| Spanish | 0.8 /100 | #242 | Tragic 2.6% |
| Hawaiians | 0.8 /100 | #243 | Tragic 2.6% |
| Yuman | 0.8 /100 | #244 | Tragic 2.6% |
| Immigrants | Western Asia | 0.6 /100 | #245 | Tragic 2.6% |
| Cheyenne | 0.6 /100 | #246 | Tragic 2.6% |
| Immigrants | Albania | 0.6 /100 | #247 | Tragic 2.6% |
| Nicaraguans | 0.6 /100 | #248 | Tragic 2.6% |
| Mexican American Indians | 0.5 /100 | #249 | Tragic 2.6% |
| Portuguese | 0.4 /100 | #250 | Tragic 2.6% |
| Immigrants | Liberia | 0.4 /100 | #251 | Tragic 2.6% |
| Immigrants | Bangladesh | 0.4 /100 | #252 | Tragic 2.6% |