Scotch-Irish vs Colville Self-Care Disability
COMPARE
Scotch-Irish
Colville
Self-Care Disability
Self-Care Disability Comparison
Scotch-Irish
Colville
2.6%
SELF-CARE DISABILITY
4.1/ 100
METRIC RATING
218th/ 347
METRIC RANK
3.1%
SELF-CARE DISABILITY
0.0/ 100
METRIC RATING
342nd/ 347
METRIC RANK
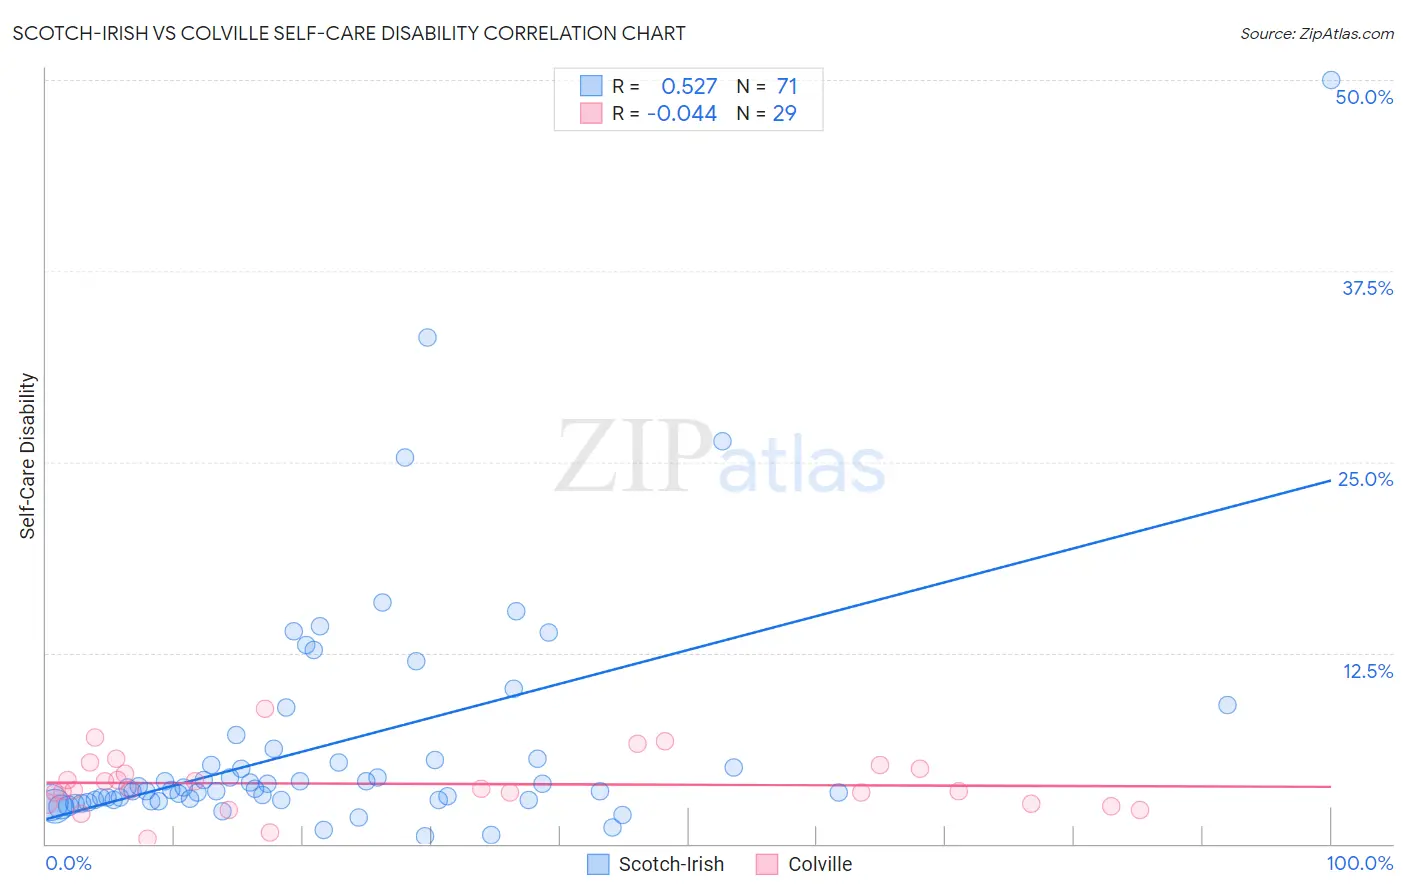
Scotch-Irish vs Colville Self-Care Disability Correlation Chart
The statistical analysis conducted on geographies consisting of 547,085,910 people shows a substantial positive correlation between the proportion of Scotch-Irish and percentage of population with self-care disability in the United States with a correlation coefficient (R) of 0.527 and weighted average of 2.6%. Similarly, the statistical analysis conducted on geographies consisting of 34,670,856 people shows no correlation between the proportion of Colville and percentage of population with self-care disability in the United States with a correlation coefficient (R) of -0.044 and weighted average of 3.1%, a difference of 21.6%.
Self-Care Disability Correlation Summary
| Measurement | Scotch-Irish | Colville |
| Minimum | 0.47% | 0.29% |
| Maximum | 50.0% | 8.8% |
| Range | 49.5% | 8.6% |
| Mean | 6.5% | 3.9% |
| Median | 3.6% | 3.6% |
| Interquartile 25% (IQ1) | 2.8% | 2.6% |
| Interquartile 75% (IQ3) | 5.6% | 5.0% |
| Interquartile Range (IQR) | 2.7% | 2.4% |
| Standard Deviation (Sample) | 8.0% | 1.9% |
| Standard Deviation (Population) | 7.9% | 1.8% |
Similar Demographics by Self-Care Disability
Demographics Similar to Scotch-Irish by Self-Care Disability
In terms of self-care disability, the demographic groups most similar to Scotch-Irish are Immigrants from Moldova (2.6%, a difference of 0.030%), Subsaharan African (2.6%, a difference of 0.040%), Celtic (2.6%, a difference of 0.070%), Honduran (2.6%, a difference of 0.080%), and White/Caucasian (2.6%, a difference of 0.090%).
| Demographics | Rating | Rank | Self-Care Disability |
| Native Hawaiians | 5.1 /100 | #211 | Tragic 2.6% |
| Samoans | 5.1 /100 | #212 | Tragic 2.6% |
| Ecuadorians | 4.7 /100 | #213 | Tragic 2.6% |
| Immigrants | Honduras | 4.7 /100 | #214 | Tragic 2.6% |
| Immigrants | Thailand | 4.5 /100 | #215 | Tragic 2.6% |
| Whites/Caucasians | 4.4 /100 | #216 | Tragic 2.6% |
| Celtics | 4.4 /100 | #217 | Tragic 2.6% |
| Scotch-Irish | 4.1 /100 | #218 | Tragic 2.6% |
| Immigrants | Moldova | 4.0 /100 | #219 | Tragic 2.6% |
| Sub-Saharan Africans | 4.0 /100 | #220 | Tragic 2.6% |
| Hondurans | 3.8 /100 | #221 | Tragic 2.6% |
| Spaniards | 3.8 /100 | #222 | Tragic 2.6% |
| French Canadians | 3.8 /100 | #223 | Tragic 2.6% |
| Osage | 3.6 /100 | #224 | Tragic 2.6% |
| Iraqis | 3.2 /100 | #225 | Tragic 2.6% |
Demographics Similar to Colville by Self-Care Disability
In terms of self-care disability, the demographic groups most similar to Colville are Tohono O'odham (3.1%, a difference of 0.11%), Dominican (3.1%, a difference of 1.6%), Immigrants from Cabo Verde (3.1%, a difference of 1.9%), Immigrants from Dominican Republic (3.0%, a difference of 2.2%), and Cape Verdean (3.0%, a difference of 2.6%).
| Demographics | Rating | Rank | Self-Care Disability |
| Dutch West Indians | 0.0 /100 | #333 | Tragic 3.0% |
| Houma | 0.0 /100 | #334 | Tragic 3.0% |
| Immigrants | Azores | 0.0 /100 | #335 | Tragic 3.0% |
| Immigrants | Yemen | 0.0 /100 | #336 | Tragic 3.0% |
| Choctaw | 0.0 /100 | #337 | Tragic 3.0% |
| Cape Verdeans | 0.0 /100 | #338 | Tragic 3.0% |
| Immigrants | Dominican Republic | 0.0 /100 | #339 | Tragic 3.0% |
| Immigrants | Cabo Verde | 0.0 /100 | #340 | Tragic 3.1% |
| Dominicans | 0.0 /100 | #341 | Tragic 3.1% |
| Colville | 0.0 /100 | #342 | Tragic 3.1% |
| Tohono O'odham | 0.0 /100 | #343 | Tragic 3.1% |
| Pueblo | 0.0 /100 | #344 | Tragic 3.3% |
| Armenians | 0.0 /100 | #345 | Tragic 3.4% |
| Puerto Ricans | 0.0 /100 | #346 | Tragic 3.7% |
| Immigrants | Armenia | 0.0 /100 | #347 | Tragic 4.2% |