Immigrants from Hungary vs Filipino Self-Care Disability
COMPARE
Immigrants from Hungary
Filipino
Self-Care Disability
Self-Care Disability Comparison
Immigrants from Hungary
Filipinos
2.4%
SELF-CARE DISABILITY
89.6/ 100
METRIC RATING
128th/ 347
METRIC RANK
2.2%
SELF-CARE DISABILITY
100.0/ 100
METRIC RATING
6th/ 347
METRIC RANK
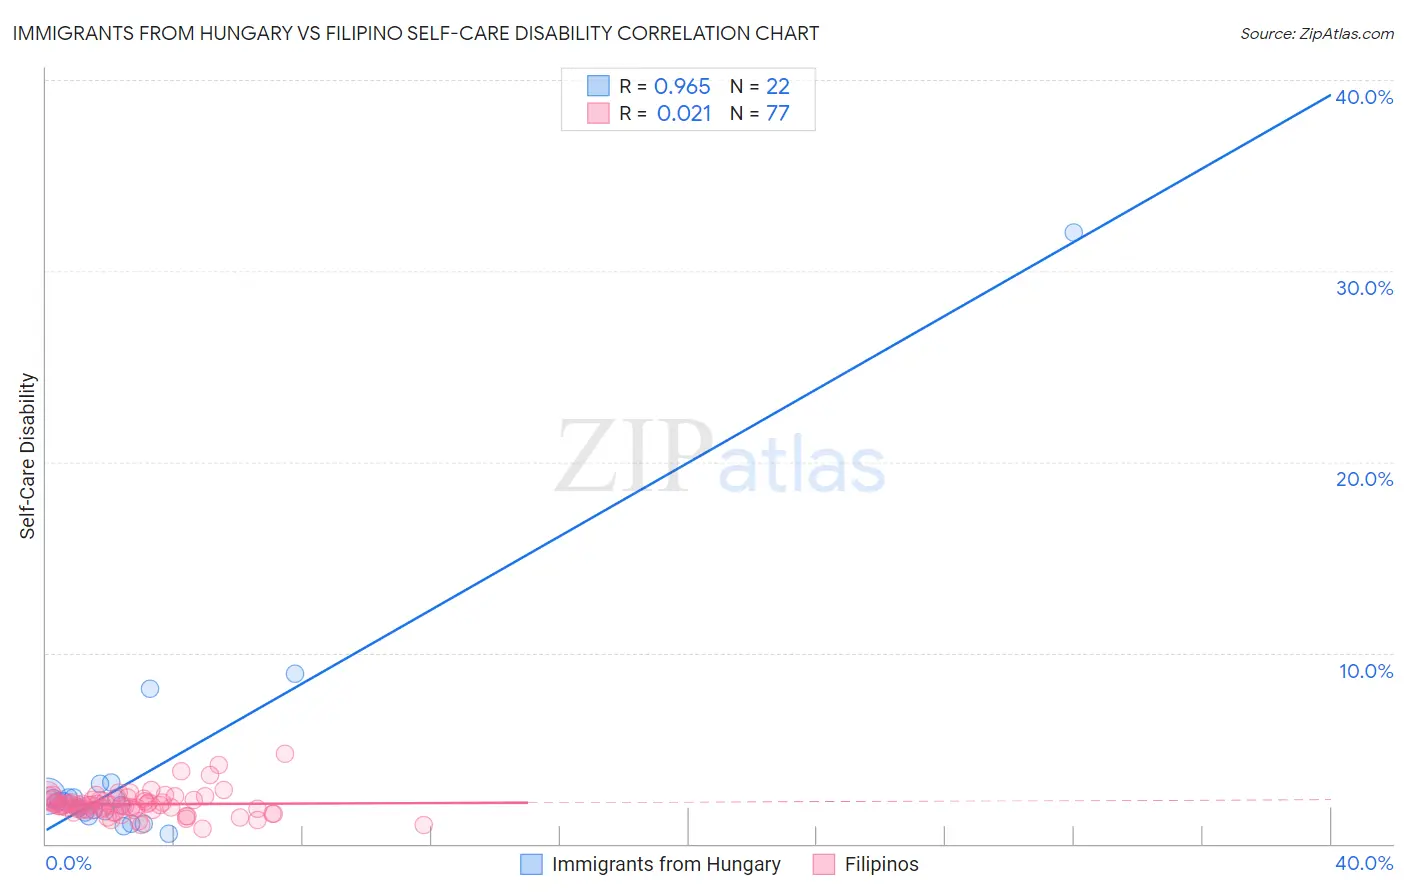
Immigrants from Hungary vs Filipino Self-Care Disability Correlation Chart
The statistical analysis conducted on geographies consisting of 195,644,142 people shows a perfect positive correlation between the proportion of Immigrants from Hungary and percentage of population with self-care disability in the United States with a correlation coefficient (R) of 0.965 and weighted average of 2.4%. Similarly, the statistical analysis conducted on geographies consisting of 254,069,032 people shows no correlation between the proportion of Filipinos and percentage of population with self-care disability in the United States with a correlation coefficient (R) of 0.021 and weighted average of 2.2%, a difference of 11.5%.
Self-Care Disability Correlation Summary
| Measurement | Immigrants from Hungary | Filipino |
| Minimum | 0.51% | 0.79% |
| Maximum | 32.0% | 4.7% |
| Range | 31.5% | 3.9% |
| Mean | 3.9% | 2.1% |
| Median | 2.2% | 2.0% |
| Interquartile 25% (IQ1) | 1.7% | 1.8% |
| Interquartile 75% (IQ3) | 2.5% | 2.3% |
| Interquartile Range (IQR) | 0.80% | 0.54% |
| Standard Deviation (Sample) | 6.6% | 0.64% |
| Standard Deviation (Population) | 6.4% | 0.64% |
Similar Demographics by Self-Care Disability
Demographics Similar to Immigrants from Hungary by Self-Care Disability
In terms of self-care disability, the demographic groups most similar to Immigrants from Hungary are Colombian (2.4%, a difference of 0.010%), Hmong (2.4%, a difference of 0.040%), Immigrants from Romania (2.4%, a difference of 0.050%), Immigrants from Morocco (2.4%, a difference of 0.080%), and Immigrants from North America (2.4%, a difference of 0.080%).
| Demographics | Rating | Rank | Self-Care Disability |
| Peruvians | 91.3 /100 | #121 | Exceptional 2.4% |
| Belgians | 90.9 /100 | #122 | Exceptional 2.4% |
| Immigrants | Nigeria | 90.3 /100 | #123 | Exceptional 2.4% |
| Immigrants | Morocco | 90.2 /100 | #124 | Exceptional 2.4% |
| Immigrants | North America | 90.2 /100 | #124 | Exceptional 2.4% |
| Hmong | 89.9 /100 | #126 | Excellent 2.4% |
| Colombians | 89.7 /100 | #127 | Excellent 2.4% |
| Immigrants | Hungary | 89.6 /100 | #128 | Excellent 2.4% |
| Immigrants | Romania | 89.3 /100 | #129 | Excellent 2.4% |
| Immigrants | Austria | 89.0 /100 | #130 | Excellent 2.4% |
| Poles | 88.9 /100 | #131 | Excellent 2.4% |
| Immigrants | South America | 88.8 /100 | #132 | Excellent 2.4% |
| Immigrants | Colombia | 88.5 /100 | #133 | Excellent 2.4% |
| Russians | 88.2 /100 | #134 | Excellent 2.4% |
| Laotians | 87.8 /100 | #135 | Excellent 2.4% |
Demographics Similar to Filipinos by Self-Care Disability
In terms of self-care disability, the demographic groups most similar to Filipinos are Immigrants from Bolivia (2.2%, a difference of 0.21%), Zimbabwean (2.2%, a difference of 0.25%), Bolivian (2.2%, a difference of 0.26%), Immigrants from Nepal (2.2%, a difference of 0.39%), and Immigrants from Singapore (2.1%, a difference of 1.2%).
| Demographics | Rating | Rank | Self-Care Disability |
| Yup'ik | 100.0 /100 | #1 | Exceptional 1.9% |
| Immigrants | India | 100.0 /100 | #2 | Exceptional 2.0% |
| Thais | 100.0 /100 | #3 | Exceptional 2.1% |
| Immigrants | Singapore | 100.0 /100 | #4 | Exceptional 2.1% |
| Zimbabweans | 100.0 /100 | #5 | Exceptional 2.2% |
| Filipinos | 100.0 /100 | #6 | Exceptional 2.2% |
| Immigrants | Bolivia | 100.0 /100 | #7 | Exceptional 2.2% |
| Bolivians | 100.0 /100 | #8 | Exceptional 2.2% |
| Immigrants | Nepal | 100.0 /100 | #9 | Exceptional 2.2% |
| Sudanese | 100.0 /100 | #10 | Exceptional 2.2% |
| Immigrants | South Central Asia | 100.0 /100 | #11 | Exceptional 2.2% |
| Immigrants | Ethiopia | 100.0 /100 | #12 | Exceptional 2.2% |
| Ethiopians | 100.0 /100 | #13 | Exceptional 2.2% |
| Luxembourgers | 100.0 /100 | #14 | Exceptional 2.2% |
| Okinawans | 100.0 /100 | #15 | Exceptional 2.2% |