Syrian vs Filipino Self-Care Disability
COMPARE
Syrian
Filipino
Self-Care Disability
Self-Care Disability Comparison
Syrians
Filipinos
2.5%
SELF-CARE DISABILITY
59.0/ 100
METRIC RATING
165th/ 347
METRIC RANK
2.2%
SELF-CARE DISABILITY
100.0/ 100
METRIC RATING
6th/ 347
METRIC RANK
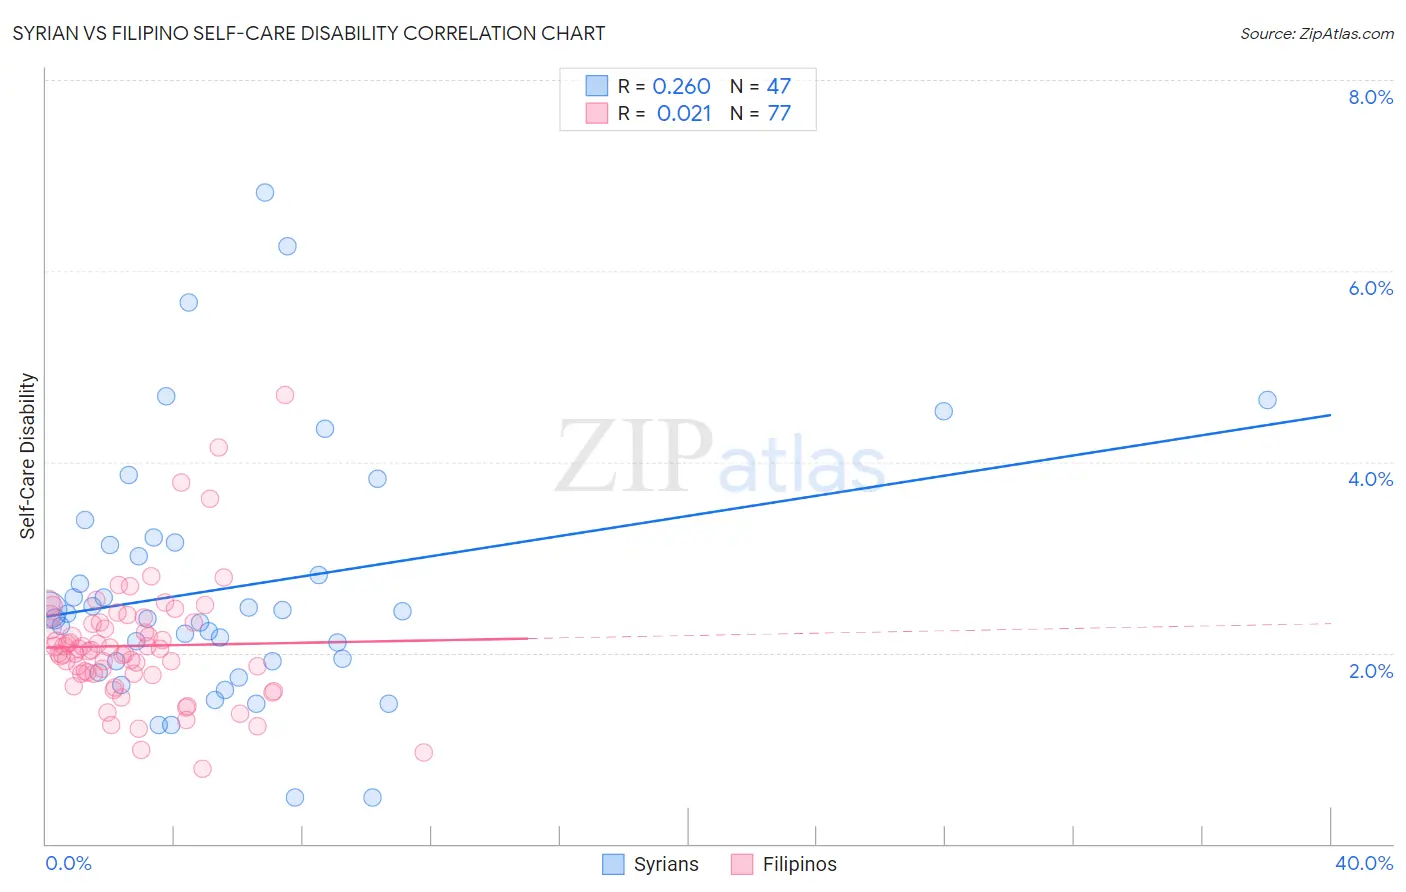
Syrian vs Filipino Self-Care Disability Correlation Chart
The statistical analysis conducted on geographies consisting of 266,133,932 people shows a weak positive correlation between the proportion of Syrians and percentage of population with self-care disability in the United States with a correlation coefficient (R) of 0.260 and weighted average of 2.5%. Similarly, the statistical analysis conducted on geographies consisting of 254,069,032 people shows no correlation between the proportion of Filipinos and percentage of population with self-care disability in the United States with a correlation coefficient (R) of 0.021 and weighted average of 2.2%, a difference of 13.9%.
Self-Care Disability Correlation Summary
| Measurement | Syrian | Filipino |
| Minimum | 0.49% | 0.79% |
| Maximum | 6.8% | 4.7% |
| Range | 6.3% | 3.9% |
| Mean | 2.7% | 2.1% |
| Median | 2.4% | 2.0% |
| Interquartile 25% (IQ1) | 1.9% | 1.8% |
| Interquartile 75% (IQ3) | 3.2% | 2.3% |
| Interquartile Range (IQR) | 1.3% | 0.54% |
| Standard Deviation (Sample) | 1.3% | 0.64% |
| Standard Deviation (Population) | 1.3% | 0.64% |
Similar Demographics by Self-Care Disability
Demographics Similar to Syrians by Self-Care Disability
In terms of self-care disability, the demographic groups most similar to Syrians are Canadian (2.5%, a difference of 0.010%), Immigrants from Vietnam (2.5%, a difference of 0.020%), Immigrants from Greece (2.5%, a difference of 0.080%), Ute (2.5%, a difference of 0.090%), and Immigrants from Somalia (2.5%, a difference of 0.15%).
| Demographics | Rating | Rank | Self-Care Disability |
| Immigrants | Western Europe | 68.6 /100 | #158 | Good 2.4% |
| Immigrants | Italy | 68.5 /100 | #159 | Good 2.4% |
| Finns | 67.0 /100 | #160 | Good 2.4% |
| Lebanese | 66.5 /100 | #161 | Good 2.4% |
| Somalis | 63.7 /100 | #162 | Good 2.5% |
| German Russians | 62.7 /100 | #163 | Good 2.5% |
| Immigrants | Vietnam | 59.3 /100 | #164 | Average 2.5% |
| Syrians | 59.0 /100 | #165 | Average 2.5% |
| Canadians | 58.8 /100 | #166 | Average 2.5% |
| Immigrants | Greece | 57.3 /100 | #167 | Average 2.5% |
| Ute | 57.1 /100 | #168 | Average 2.5% |
| Immigrants | Somalia | 55.9 /100 | #169 | Average 2.5% |
| Scottish | 54.3 /100 | #170 | Average 2.5% |
| Pennsylvania Germans | 53.5 /100 | #171 | Average 2.5% |
| Czechoslovakians | 53.5 /100 | #172 | Average 2.5% |
Demographics Similar to Filipinos by Self-Care Disability
In terms of self-care disability, the demographic groups most similar to Filipinos are Immigrants from Bolivia (2.2%, a difference of 0.21%), Zimbabwean (2.2%, a difference of 0.25%), Bolivian (2.2%, a difference of 0.26%), Immigrants from Nepal (2.2%, a difference of 0.39%), and Immigrants from Singapore (2.1%, a difference of 1.2%).
| Demographics | Rating | Rank | Self-Care Disability |
| Yup'ik | 100.0 /100 | #1 | Exceptional 1.9% |
| Immigrants | India | 100.0 /100 | #2 | Exceptional 2.0% |
| Thais | 100.0 /100 | #3 | Exceptional 2.1% |
| Immigrants | Singapore | 100.0 /100 | #4 | Exceptional 2.1% |
| Zimbabweans | 100.0 /100 | #5 | Exceptional 2.2% |
| Filipinos | 100.0 /100 | #6 | Exceptional 2.2% |
| Immigrants | Bolivia | 100.0 /100 | #7 | Exceptional 2.2% |
| Bolivians | 100.0 /100 | #8 | Exceptional 2.2% |
| Immigrants | Nepal | 100.0 /100 | #9 | Exceptional 2.2% |
| Sudanese | 100.0 /100 | #10 | Exceptional 2.2% |
| Immigrants | South Central Asia | 100.0 /100 | #11 | Exceptional 2.2% |
| Immigrants | Ethiopia | 100.0 /100 | #12 | Exceptional 2.2% |
| Ethiopians | 100.0 /100 | #13 | Exceptional 2.2% |
| Luxembourgers | 100.0 /100 | #14 | Exceptional 2.2% |
| Okinawans | 100.0 /100 | #15 | Exceptional 2.2% |