Scotch-Irish vs Nepalese Disability
COMPARE
Scotch-Irish
Nepalese
Disability
Disability Comparison
Scotch-Irish
Nepalese
13.3%
DISABILITY
0.0/ 100
METRIC RATING
303rd/ 347
METRIC RANK
12.8%
DISABILITY
0.0/ 100
METRIC RATING
274th/ 347
METRIC RANK
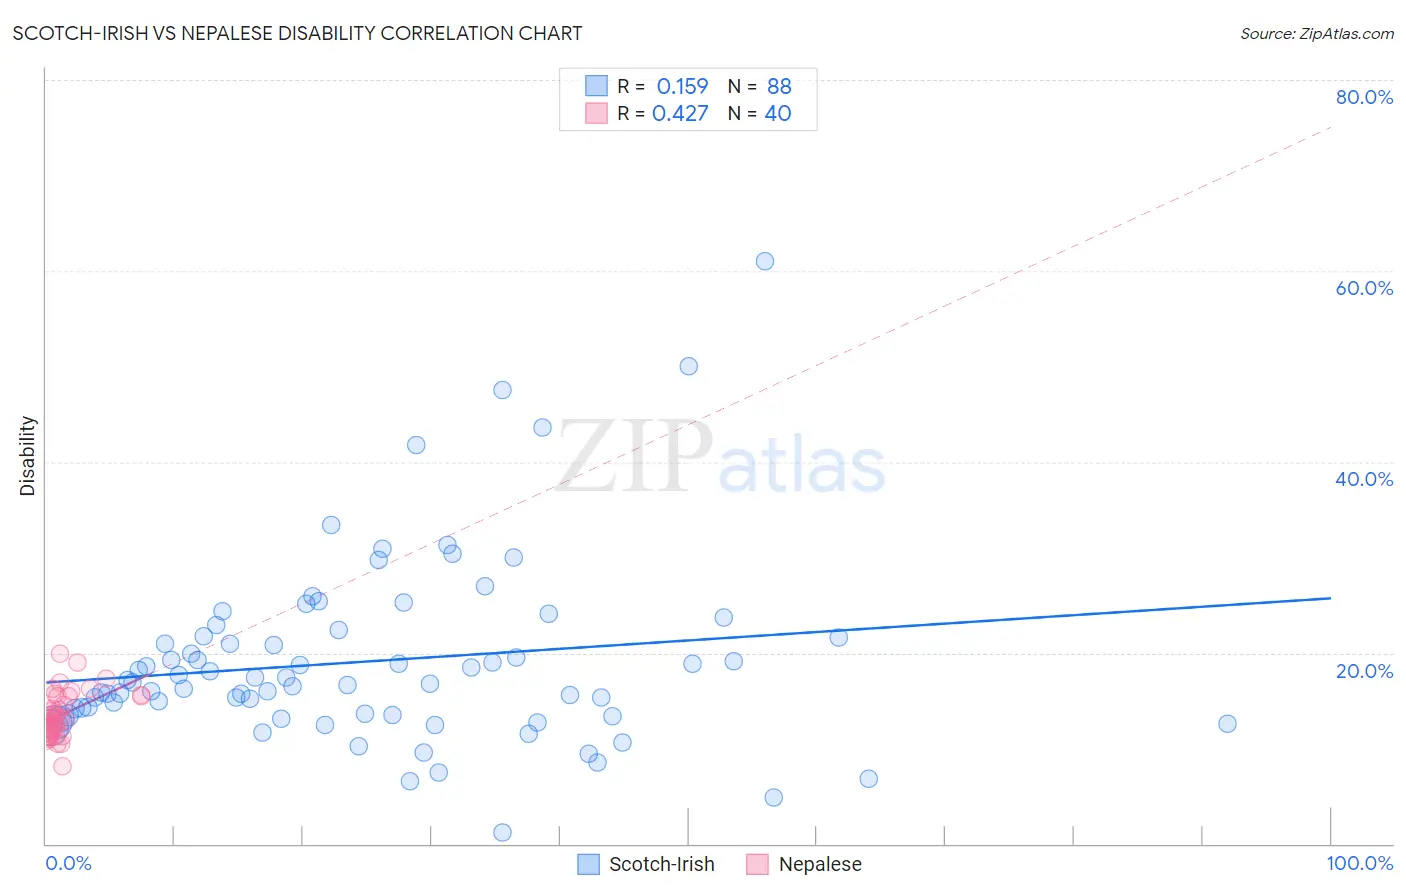
Scotch-Irish vs Nepalese Disability Correlation Chart
The statistical analysis conducted on geographies consisting of 548,670,555 people shows a poor positive correlation between the proportion of Scotch-Irish and percentage of population with a disability in the United States with a correlation coefficient (R) of 0.159 and weighted average of 13.3%. Similarly, the statistical analysis conducted on geographies consisting of 24,521,755 people shows a moderate positive correlation between the proportion of Nepalese and percentage of population with a disability in the United States with a correlation coefficient (R) of 0.427 and weighted average of 12.8%, a difference of 4.3%.
Disability Correlation Summary
| Measurement | Scotch-Irish | Nepalese |
| Minimum | 1.2% | 8.1% |
| Maximum | 61.0% | 19.9% |
| Range | 59.8% | 11.8% |
| Mean | 19.1% | 13.5% |
| Median | 16.8% | 13.1% |
| Interquartile 25% (IQ1) | 13.5% | 11.6% |
| Interquartile 75% (IQ3) | 21.7% | 15.5% |
| Interquartile Range (IQR) | 8.2% | 3.9% |
| Standard Deviation (Sample) | 9.6% | 2.5% |
| Standard Deviation (Population) | 9.6% | 2.4% |
Similar Demographics by Disability
Demographics Similar to Scotch-Irish by Disability
In terms of disability, the demographic groups most similar to Scotch-Irish are Yakama (13.4%, a difference of 0.47%), Arapaho (13.2%, a difference of 0.78%), French Canadian (13.4%, a difference of 0.81%), Immigrants from Micronesia (13.2%, a difference of 0.99%), and Pennsylvania German (13.2%, a difference of 1.1%).
| Demographics | Rating | Rank | Disability |
| Central American Indians | 0.0 /100 | #296 | Tragic 13.2% |
| Hopi | 0.0 /100 | #297 | Tragic 13.2% |
| Alaska Natives | 0.0 /100 | #298 | Tragic 13.2% |
| French | 0.0 /100 | #299 | Tragic 13.2% |
| Pennsylvania Germans | 0.0 /100 | #300 | Tragic 13.2% |
| Immigrants | Micronesia | 0.0 /100 | #301 | Tragic 13.2% |
| Arapaho | 0.0 /100 | #302 | Tragic 13.2% |
| Scotch-Irish | 0.0 /100 | #303 | Tragic 13.3% |
| Yakama | 0.0 /100 | #304 | Tragic 13.4% |
| French Canadians | 0.0 /100 | #305 | Tragic 13.4% |
| Cape Verdeans | 0.0 /100 | #306 | Tragic 13.5% |
| Shoshone | 0.0 /100 | #307 | Tragic 13.5% |
| French American Indians | 0.0 /100 | #308 | Tragic 13.5% |
| Tlingit-Haida | 0.0 /100 | #309 | Tragic 13.5% |
| Blackfeet | 0.0 /100 | #310 | Tragic 13.6% |
Demographics Similar to Nepalese by Disability
In terms of disability, the demographic groups most similar to Nepalese are Sioux (12.8%, a difference of 0.080%), Hmong (12.8%, a difference of 0.23%), Dutch (12.8%, a difference of 0.28%), Finnish (12.7%, a difference of 0.43%), and German (12.8%, a difference of 0.45%).
| Demographics | Rating | Rank | Disability |
| Spaniards | 0.2 /100 | #267 | Tragic 12.5% |
| Bangladeshis | 0.1 /100 | #268 | Tragic 12.6% |
| Immigrants | Dominican Republic | 0.1 /100 | #269 | Tragic 12.6% |
| Portuguese | 0.1 /100 | #270 | Tragic 12.6% |
| Immigrants | Yemen | 0.1 /100 | #271 | Tragic 12.6% |
| Dominicans | 0.0 /100 | #272 | Tragic 12.7% |
| Finns | 0.0 /100 | #273 | Tragic 12.7% |
| Nepalese | 0.0 /100 | #274 | Tragic 12.8% |
| Sioux | 0.0 /100 | #275 | Tragic 12.8% |
| Hmong | 0.0 /100 | #276 | Tragic 12.8% |
| Dutch | 0.0 /100 | #277 | Tragic 12.8% |
| Germans | 0.0 /100 | #278 | Tragic 12.8% |
| Fijians | 0.0 /100 | #279 | Tragic 12.8% |
| Spanish | 0.0 /100 | #280 | Tragic 12.8% |
| Immigrants | Portugal | 0.0 /100 | #281 | Tragic 12.9% |