Scotch-Irish vs Immigrants from Dominica Disability
COMPARE
Scotch-Irish
Immigrants from Dominica
Disability
Disability Comparison
Scotch-Irish
Immigrants from Dominica
13.3%
DISABILITY
0.0/ 100
METRIC RATING
303rd/ 347
METRIC RANK
12.4%
DISABILITY
0.6/ 100
METRIC RATING
256th/ 347
METRIC RANK
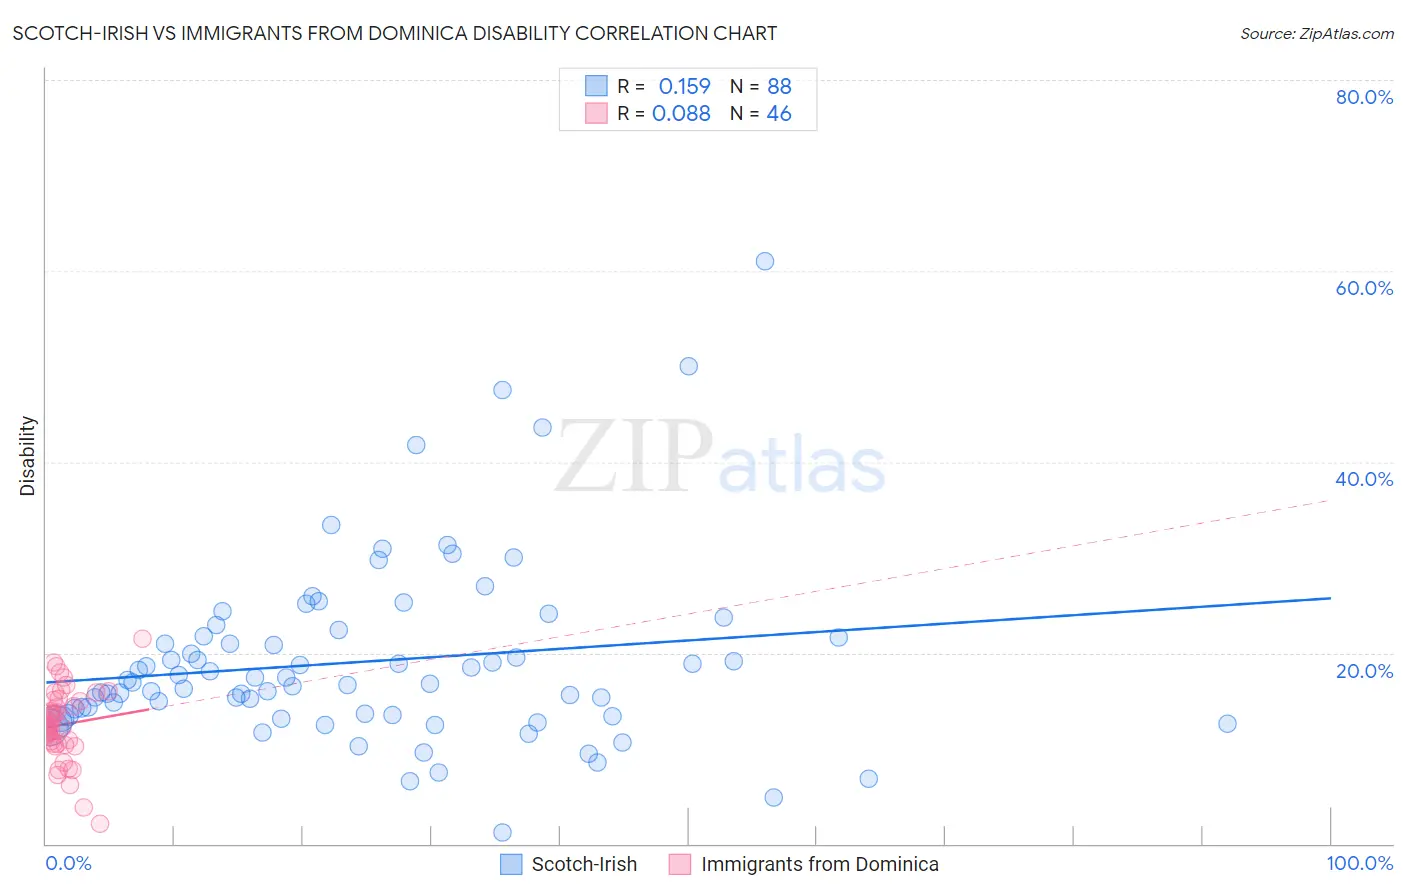
Scotch-Irish vs Immigrants from Dominica Disability Correlation Chart
The statistical analysis conducted on geographies consisting of 548,670,555 people shows a poor positive correlation between the proportion of Scotch-Irish and percentage of population with a disability in the United States with a correlation coefficient (R) of 0.159 and weighted average of 13.3%. Similarly, the statistical analysis conducted on geographies consisting of 83,793,635 people shows a slight positive correlation between the proportion of Immigrants from Dominica and percentage of population with a disability in the United States with a correlation coefficient (R) of 0.088 and weighted average of 12.4%, a difference of 7.7%.
Disability Correlation Summary
| Measurement | Scotch-Irish | Immigrants from Dominica |
| Minimum | 1.2% | 2.1% |
| Maximum | 61.0% | 21.5% |
| Range | 59.8% | 19.4% |
| Mean | 19.1% | 12.5% |
| Median | 16.8% | 12.4% |
| Interquartile 25% (IQ1) | 13.5% | 10.4% |
| Interquartile 75% (IQ3) | 21.7% | 15.1% |
| Interquartile Range (IQR) | 8.2% | 4.7% |
| Standard Deviation (Sample) | 9.6% | 3.9% |
| Standard Deviation (Population) | 9.6% | 3.9% |
Similar Demographics by Disability
Demographics Similar to Scotch-Irish by Disability
In terms of disability, the demographic groups most similar to Scotch-Irish are Yakama (13.4%, a difference of 0.47%), Arapaho (13.2%, a difference of 0.78%), French Canadian (13.4%, a difference of 0.81%), Immigrants from Micronesia (13.2%, a difference of 0.99%), and Pennsylvania German (13.2%, a difference of 1.1%).
| Demographics | Rating | Rank | Disability |
| Central American Indians | 0.0 /100 | #296 | Tragic 13.2% |
| Hopi | 0.0 /100 | #297 | Tragic 13.2% |
| Alaska Natives | 0.0 /100 | #298 | Tragic 13.2% |
| French | 0.0 /100 | #299 | Tragic 13.2% |
| Pennsylvania Germans | 0.0 /100 | #300 | Tragic 13.2% |
| Immigrants | Micronesia | 0.0 /100 | #301 | Tragic 13.2% |
| Arapaho | 0.0 /100 | #302 | Tragic 13.2% |
| Scotch-Irish | 0.0 /100 | #303 | Tragic 13.3% |
| Yakama | 0.0 /100 | #304 | Tragic 13.4% |
| French Canadians | 0.0 /100 | #305 | Tragic 13.4% |
| Cape Verdeans | 0.0 /100 | #306 | Tragic 13.5% |
| Shoshone | 0.0 /100 | #307 | Tragic 13.5% |
| French American Indians | 0.0 /100 | #308 | Tragic 13.5% |
| Tlingit-Haida | 0.0 /100 | #309 | Tragic 13.5% |
| Blackfeet | 0.0 /100 | #310 | Tragic 13.6% |
Demographics Similar to Immigrants from Dominica by Disability
In terms of disability, the demographic groups most similar to Immigrants from Dominica are Slovene (12.4%, a difference of 0.070%), Immigrants from Laos (12.4%, a difference of 0.090%), Slavic (12.4%, a difference of 0.23%), Canadian (12.4%, a difference of 0.29%), and Immigrants from Liberia (12.4%, a difference of 0.32%).
| Demographics | Rating | Rank | Disability |
| Carpatho Rusyns | 1.4 /100 | #249 | Tragic 12.3% |
| Sub-Saharan Africans | 1.4 /100 | #250 | Tragic 12.3% |
| Europeans | 1.4 /100 | #251 | Tragic 12.3% |
| Bermudans | 1.1 /100 | #252 | Tragic 12.3% |
| Belgians | 0.8 /100 | #253 | Tragic 12.3% |
| German Russians | 0.8 /100 | #254 | Tragic 12.3% |
| Slovenes | 0.6 /100 | #255 | Tragic 12.4% |
| Immigrants | Dominica | 0.6 /100 | #256 | Tragic 12.4% |
| Immigrants | Laos | 0.5 /100 | #257 | Tragic 12.4% |
| Slavs | 0.5 /100 | #258 | Tragic 12.4% |
| Canadians | 0.4 /100 | #259 | Tragic 12.4% |
| Immigrants | Liberia | 0.4 /100 | #260 | Tragic 12.4% |
| Scandinavians | 0.4 /100 | #261 | Tragic 12.4% |
| Native Hawaiians | 0.3 /100 | #262 | Tragic 12.5% |
| Hawaiians | 0.2 /100 | #263 | Tragic 12.5% |