Senegalese vs Afghan Disability
COMPARE
Senegalese
Afghan
Disability
Disability Comparison
Senegalese
Afghans
12.1%
DISABILITY
3.5/ 100
METRIC RATING
225th/ 347
METRIC RANK
10.8%
DISABILITY
99.9/ 100
METRIC RATING
38th/ 347
METRIC RANK
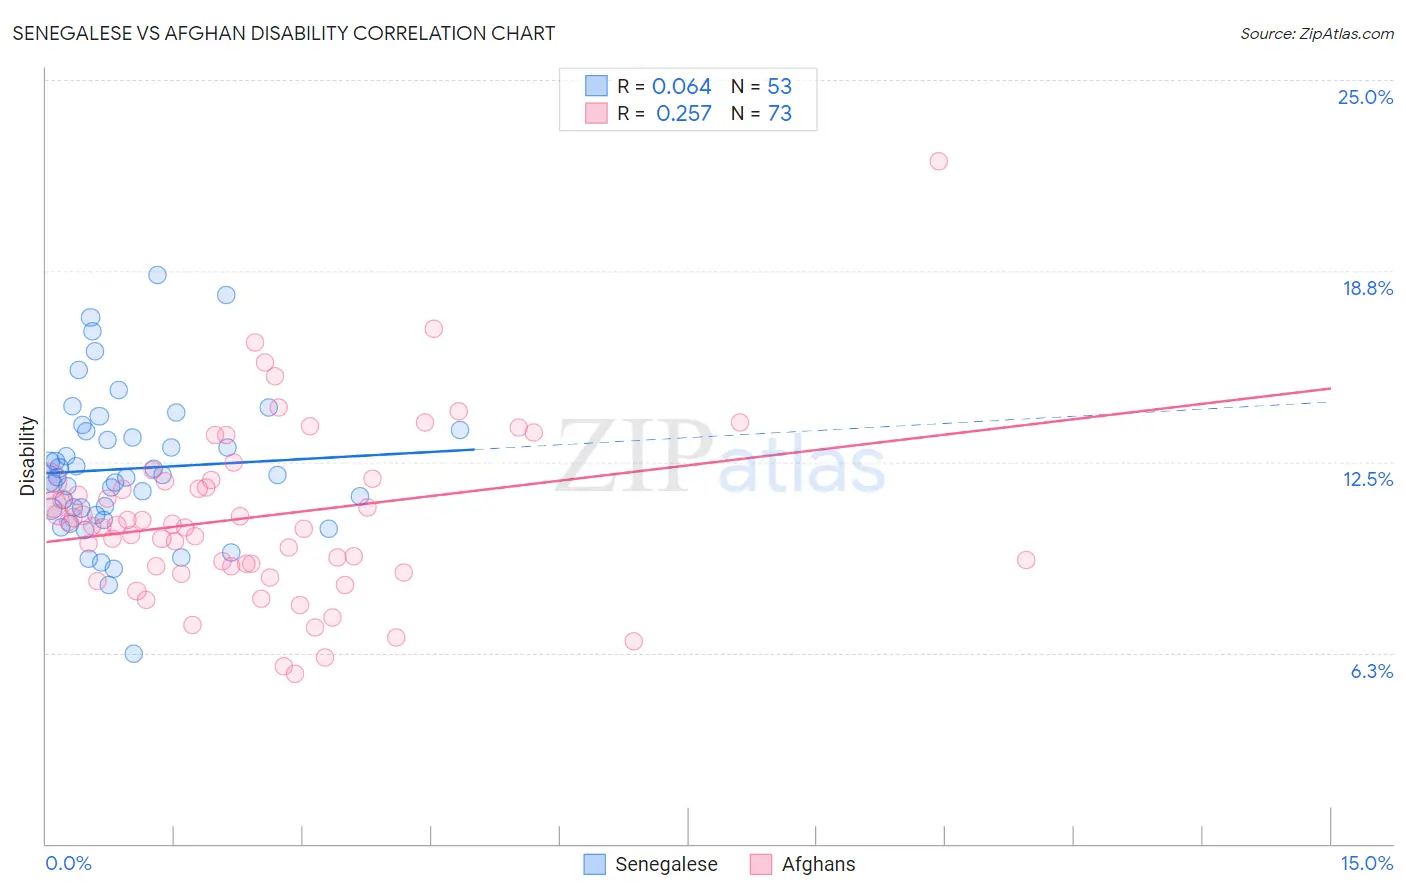
Senegalese vs Afghan Disability Correlation Chart
The statistical analysis conducted on geographies consisting of 78,141,203 people shows a slight positive correlation between the proportion of Senegalese and percentage of population with a disability in the United States with a correlation coefficient (R) of 0.064 and weighted average of 12.1%. Similarly, the statistical analysis conducted on geographies consisting of 148,869,641 people shows a weak positive correlation between the proportion of Afghans and percentage of population with a disability in the United States with a correlation coefficient (R) of 0.257 and weighted average of 10.8%, a difference of 12.8%.
Disability Correlation Summary
| Measurement | Senegalese | Afghan |
| Minimum | 6.2% | 5.6% |
| Maximum | 18.6% | 22.3% |
| Range | 12.4% | 16.8% |
| Mean | 12.3% | 10.7% |
| Median | 12.0% | 10.4% |
| Interquartile 25% (IQ1) | 10.9% | 9.1% |
| Interquartile 75% (IQ3) | 13.5% | 11.9% |
| Interquartile Range (IQR) | 2.6% | 2.8% |
| Standard Deviation (Sample) | 2.4% | 2.8% |
| Standard Deviation (Population) | 2.4% | 2.8% |
Similar Demographics by Disability
Demographics Similar to Senegalese by Disability
In terms of disability, the demographic groups most similar to Senegalese are Jamaican (12.1%, a difference of 0.050%), Alsatian (12.1%, a difference of 0.060%), Mexican (12.1%, a difference of 0.080%), Hispanic or Latino (12.1%, a difference of 0.15%), and Spanish American Indian (12.1%, a difference of 0.18%).
| Demographics | Rating | Rank | Disability |
| Immigrants | Jamaica | 5.0 /100 | #218 | Tragic 12.1% |
| Croatians | 4.9 /100 | #219 | Tragic 12.1% |
| Immigrants | Bahamas | 4.7 /100 | #220 | Tragic 12.1% |
| Northern Europeans | 4.2 /100 | #221 | Tragic 12.1% |
| Spanish American Indians | 4.1 /100 | #222 | Tragic 12.1% |
| Hispanics or Latinos | 3.9 /100 | #223 | Tragic 12.1% |
| Mexicans | 3.7 /100 | #224 | Tragic 12.1% |
| Senegalese | 3.5 /100 | #225 | Tragic 12.1% |
| Jamaicans | 3.3 /100 | #226 | Tragic 12.1% |
| Alsatians | 3.3 /100 | #227 | Tragic 12.1% |
| West Indians | 2.9 /100 | #228 | Tragic 12.2% |
| Inupiat | 2.8 /100 | #229 | Tragic 12.2% |
| Samoans | 2.6 /100 | #230 | Tragic 12.2% |
| Malaysians | 2.5 /100 | #231 | Tragic 12.2% |
| Italians | 2.5 /100 | #232 | Tragic 12.2% |
Demographics Similar to Afghans by Disability
In terms of disability, the demographic groups most similar to Afghans are Cambodian (10.8%, a difference of 0.10%), Mongolian (10.8%, a difference of 0.10%), Immigrants from Australia (10.8%, a difference of 0.15%), Immigrants from Nepal (10.8%, a difference of 0.25%), and Israeli (10.8%, a difference of 0.29%).
| Demographics | Rating | Rank | Disability |
| Immigrants | Egypt | 100.0 /100 | #31 | Exceptional 10.6% |
| Paraguayans | 100.0 /100 | #32 | Exceptional 10.6% |
| Immigrants | Kuwait | 100.0 /100 | #33 | Exceptional 10.7% |
| Immigrants | Ethiopia | 100.0 /100 | #34 | Exceptional 10.7% |
| Immigrants | Indonesia | 100.0 /100 | #35 | Exceptional 10.7% |
| Ethiopians | 100.0 /100 | #36 | Exceptional 10.7% |
| Turks | 100.0 /100 | #37 | Exceptional 10.7% |
| Afghans | 99.9 /100 | #38 | Exceptional 10.8% |
| Cambodians | 99.9 /100 | #39 | Exceptional 10.8% |
| Mongolians | 99.9 /100 | #40 | Exceptional 10.8% |
| Immigrants | Australia | 99.9 /100 | #41 | Exceptional 10.8% |
| Immigrants | Nepal | 99.9 /100 | #42 | Exceptional 10.8% |
| Israelis | 99.9 /100 | #43 | Exceptional 10.8% |
| Immigrants | Japan | 99.9 /100 | #44 | Exceptional 10.8% |
| Immigrants | Peru | 99.9 /100 | #45 | Exceptional 10.8% |