Scotch-Irish vs Yup'ik Disability
COMPARE
Scotch-Irish
Yup'ik
Disability
Disability Comparison
Scotch-Irish
Yup'ik
13.3%
DISABILITY
0.0/ 100
METRIC RATING
303rd/ 347
METRIC RANK
12.2%
DISABILITY
2.2/ 100
METRIC RATING
235th/ 347
METRIC RANK
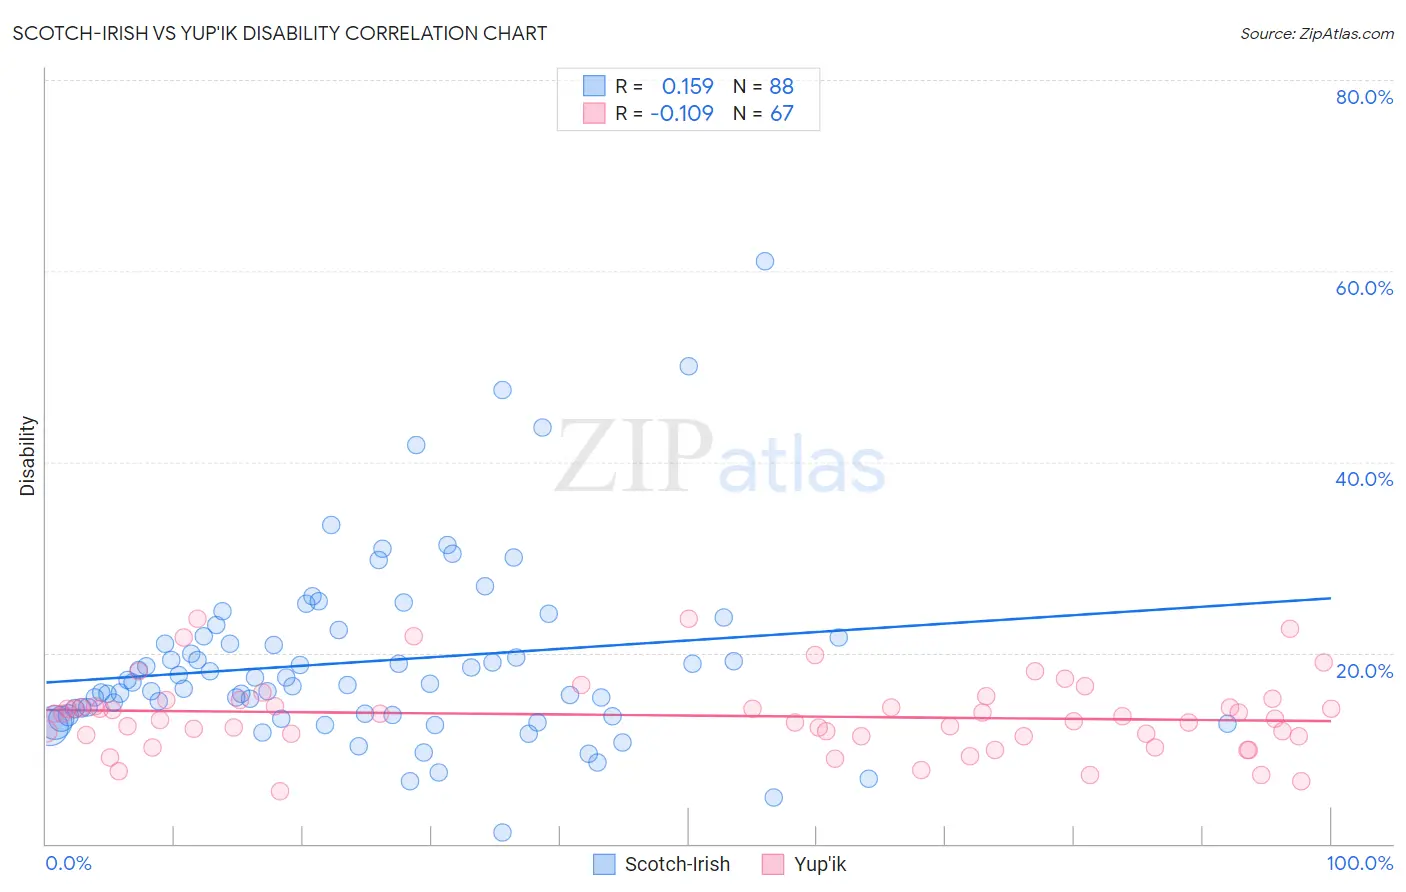
Scotch-Irish vs Yup'ik Disability Correlation Chart
The statistical analysis conducted on geographies consisting of 548,670,555 people shows a poor positive correlation between the proportion of Scotch-Irish and percentage of population with a disability in the United States with a correlation coefficient (R) of 0.159 and weighted average of 13.3%. Similarly, the statistical analysis conducted on geographies consisting of 39,961,482 people shows a poor negative correlation between the proportion of Yup'ik and percentage of population with a disability in the United States with a correlation coefficient (R) of -0.109 and weighted average of 12.2%, a difference of 9.2%.
Disability Correlation Summary
| Measurement | Scotch-Irish | Yup'ik |
| Minimum | 1.2% | 5.5% |
| Maximum | 61.0% | 23.6% |
| Range | 59.8% | 18.1% |
| Mean | 19.1% | 13.4% |
| Median | 16.8% | 13.3% |
| Interquartile 25% (IQ1) | 13.5% | 11.3% |
| Interquartile 75% (IQ3) | 21.7% | 15.0% |
| Interquartile Range (IQR) | 8.2% | 3.7% |
| Standard Deviation (Sample) | 9.6% | 3.9% |
| Standard Deviation (Population) | 9.6% | 3.9% |
Similar Demographics by Disability
Demographics Similar to Scotch-Irish by Disability
In terms of disability, the demographic groups most similar to Scotch-Irish are Yakama (13.4%, a difference of 0.47%), Arapaho (13.2%, a difference of 0.78%), French Canadian (13.4%, a difference of 0.81%), Immigrants from Micronesia (13.2%, a difference of 0.99%), and Pennsylvania German (13.2%, a difference of 1.1%).
| Demographics | Rating | Rank | Disability |
| Central American Indians | 0.0 /100 | #296 | Tragic 13.2% |
| Hopi | 0.0 /100 | #297 | Tragic 13.2% |
| Alaska Natives | 0.0 /100 | #298 | Tragic 13.2% |
| French | 0.0 /100 | #299 | Tragic 13.2% |
| Pennsylvania Germans | 0.0 /100 | #300 | Tragic 13.2% |
| Immigrants | Micronesia | 0.0 /100 | #301 | Tragic 13.2% |
| Arapaho | 0.0 /100 | #302 | Tragic 13.2% |
| Scotch-Irish | 0.0 /100 | #303 | Tragic 13.3% |
| Yakama | 0.0 /100 | #304 | Tragic 13.4% |
| French Canadians | 0.0 /100 | #305 | Tragic 13.4% |
| Cape Verdeans | 0.0 /100 | #306 | Tragic 13.5% |
| Shoshone | 0.0 /100 | #307 | Tragic 13.5% |
| French American Indians | 0.0 /100 | #308 | Tragic 13.5% |
| Tlingit-Haida | 0.0 /100 | #309 | Tragic 13.5% |
| Blackfeet | 0.0 /100 | #310 | Tragic 13.6% |
Demographics Similar to Yup'ik by Disability
In terms of disability, the demographic groups most similar to Yup'ik are Japanese (12.2%, a difference of 0.040%), Bahamian (12.2%, a difference of 0.070%), Chinese (12.2%, a difference of 0.090%), Immigrants from Congo (12.2%, a difference of 0.14%), and Italian (12.2%, a difference of 0.16%).
| Demographics | Rating | Rank | Disability |
| West Indians | 2.9 /100 | #228 | Tragic 12.2% |
| Inupiat | 2.8 /100 | #229 | Tragic 12.2% |
| Samoans | 2.6 /100 | #230 | Tragic 12.2% |
| Malaysians | 2.5 /100 | #231 | Tragic 12.2% |
| Italians | 2.5 /100 | #232 | Tragic 12.2% |
| Bahamians | 2.3 /100 | #233 | Tragic 12.2% |
| Japanese | 2.3 /100 | #234 | Tragic 12.2% |
| Yup'ik | 2.2 /100 | #235 | Tragic 12.2% |
| Chinese | 2.0 /100 | #236 | Tragic 12.2% |
| Immigrants | Congo | 1.9 /100 | #237 | Tragic 12.2% |
| Norwegians | 1.9 /100 | #238 | Tragic 12.2% |
| Swedes | 1.8 /100 | #239 | Tragic 12.2% |
| Hungarians | 1.7 /100 | #240 | Tragic 12.2% |
| Yugoslavians | 1.7 /100 | #241 | Tragic 12.2% |
| Poles | 1.7 /100 | #242 | Tragic 12.2% |