Scotch-Irish vs Nicaraguan Disability
COMPARE
Scotch-Irish
Nicaraguan
Disability
Disability Comparison
Scotch-Irish
Nicaraguans
13.3%
DISABILITY
0.0/ 100
METRIC RATING
303rd/ 347
METRIC RANK
11.3%
DISABILITY
96.2/ 100
METRIC RATING
107th/ 347
METRIC RANK
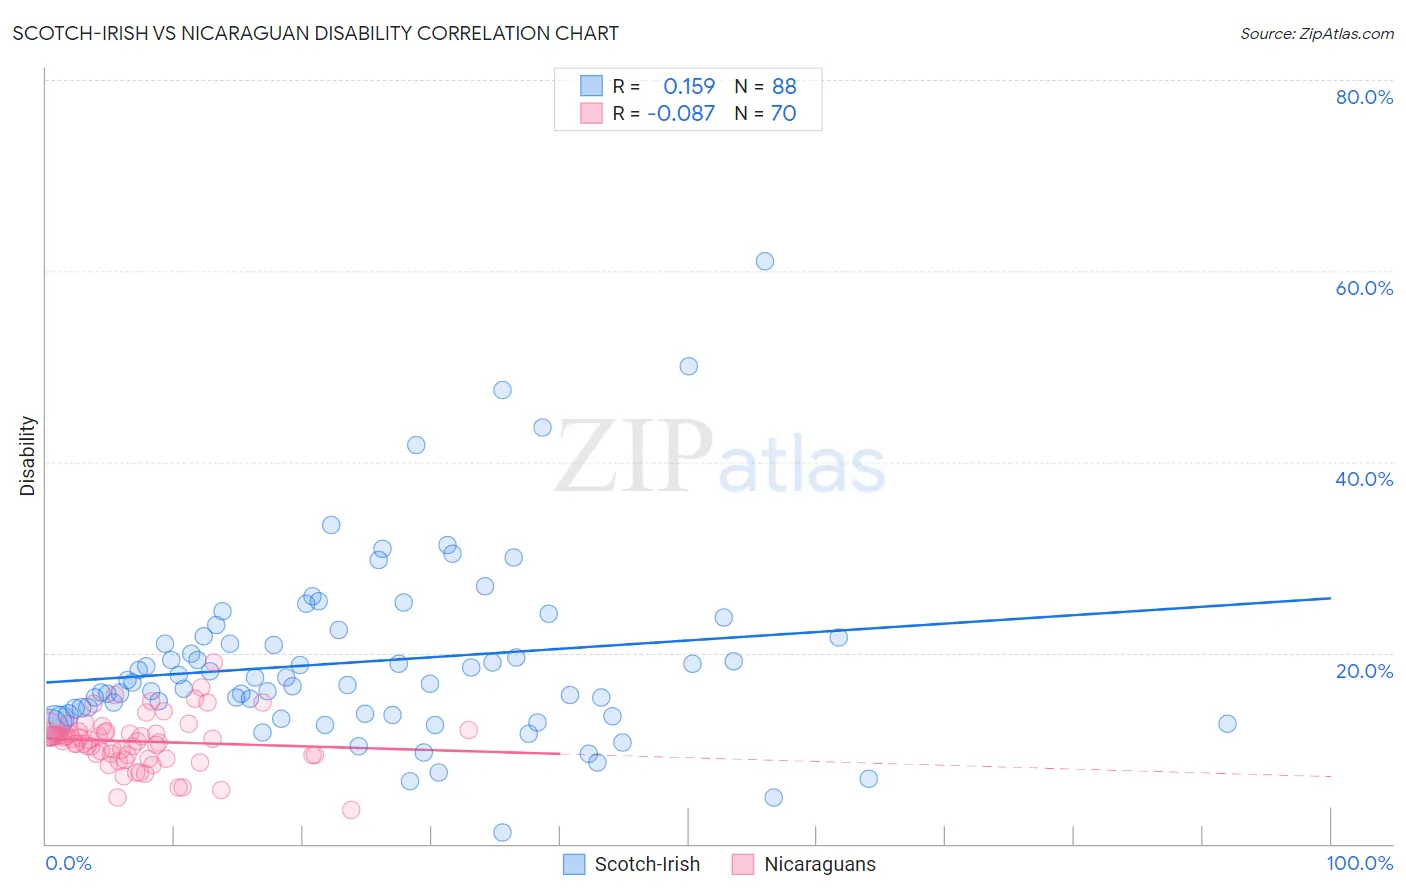
Scotch-Irish vs Nicaraguan Disability Correlation Chart
The statistical analysis conducted on geographies consisting of 548,670,555 people shows a poor positive correlation between the proportion of Scotch-Irish and percentage of population with a disability in the United States with a correlation coefficient (R) of 0.159 and weighted average of 13.3%. Similarly, the statistical analysis conducted on geographies consisting of 285,692,565 people shows a slight negative correlation between the proportion of Nicaraguans and percentage of population with a disability in the United States with a correlation coefficient (R) of -0.087 and weighted average of 11.3%, a difference of 18.1%.
Disability Correlation Summary
| Measurement | Scotch-Irish | Nicaraguan |
| Minimum | 1.2% | 3.5% |
| Maximum | 61.0% | 19.0% |
| Range | 59.8% | 15.6% |
| Mean | 19.1% | 10.7% |
| Median | 16.8% | 10.9% |
| Interquartile 25% (IQ1) | 13.5% | 9.3% |
| Interquartile 75% (IQ3) | 21.7% | 11.7% |
| Interquartile Range (IQR) | 8.2% | 2.5% |
| Standard Deviation (Sample) | 9.6% | 2.7% |
| Standard Deviation (Population) | 9.6% | 2.7% |
Similar Demographics by Disability
Demographics Similar to Scotch-Irish by Disability
In terms of disability, the demographic groups most similar to Scotch-Irish are Yakama (13.4%, a difference of 0.47%), Arapaho (13.2%, a difference of 0.78%), French Canadian (13.4%, a difference of 0.81%), Immigrants from Micronesia (13.2%, a difference of 0.99%), and Pennsylvania German (13.2%, a difference of 1.1%).
| Demographics | Rating | Rank | Disability |
| Central American Indians | 0.0 /100 | #296 | Tragic 13.2% |
| Hopi | 0.0 /100 | #297 | Tragic 13.2% |
| Alaska Natives | 0.0 /100 | #298 | Tragic 13.2% |
| French | 0.0 /100 | #299 | Tragic 13.2% |
| Pennsylvania Germans | 0.0 /100 | #300 | Tragic 13.2% |
| Immigrants | Micronesia | 0.0 /100 | #301 | Tragic 13.2% |
| Arapaho | 0.0 /100 | #302 | Tragic 13.2% |
| Scotch-Irish | 0.0 /100 | #303 | Tragic 13.3% |
| Yakama | 0.0 /100 | #304 | Tragic 13.4% |
| French Canadians | 0.0 /100 | #305 | Tragic 13.4% |
| Cape Verdeans | 0.0 /100 | #306 | Tragic 13.5% |
| Shoshone | 0.0 /100 | #307 | Tragic 13.5% |
| French American Indians | 0.0 /100 | #308 | Tragic 13.5% |
| Tlingit-Haida | 0.0 /100 | #309 | Tragic 13.5% |
| Blackfeet | 0.0 /100 | #310 | Tragic 13.6% |
Demographics Similar to Nicaraguans by Disability
In terms of disability, the demographic groups most similar to Nicaraguans are Immigrants from Eastern Europe (11.3%, a difference of 0.020%), Immigrants from Kazakhstan (11.3%, a difference of 0.050%), Immigrants from Uruguay (11.3%, a difference of 0.060%), Immigrants (11.3%, a difference of 0.060%), and Immigrants from Nigeria (11.3%, a difference of 0.080%).
| Demographics | Rating | Rank | Disability |
| Immigrants | Greece | 96.9 /100 | #100 | Exceptional 11.3% |
| Immigrants | Nicaragua | 96.8 /100 | #101 | Exceptional 11.3% |
| Immigrants | Eastern Africa | 96.7 /100 | #102 | Exceptional 11.3% |
| Immigrants | Uruguay | 96.4 /100 | #103 | Exceptional 11.3% |
| Immigrants | Immigrants | 96.4 /100 | #104 | Exceptional 11.3% |
| Immigrants | Kazakhstan | 96.4 /100 | #105 | Exceptional 11.3% |
| Immigrants | Eastern Europe | 96.3 /100 | #106 | Exceptional 11.3% |
| Nicaraguans | 96.2 /100 | #107 | Exceptional 11.3% |
| Immigrants | Nigeria | 96.0 /100 | #108 | Exceptional 11.3% |
| Immigrants | Uganda | 95.7 /100 | #109 | Exceptional 11.3% |
| Immigrants | Denmark | 95.6 /100 | #110 | Exceptional 11.3% |
| Immigrants | South Eastern Asia | 95.4 /100 | #111 | Exceptional 11.3% |
| Immigrants | Uzbekistan | 94.9 /100 | #112 | Exceptional 11.3% |
| Guyanese | 94.7 /100 | #113 | Exceptional 11.3% |
| Immigrants | Syria | 94.7 /100 | #114 | Exceptional 11.3% |