Immigrants from Western Asia vs Afghan Disability
COMPARE
Immigrants from Western Asia
Afghan
Disability
Disability Comparison
Immigrants from Western Asia
Afghans
11.2%
DISABILITY
98.1/ 100
METRIC RATING
91st/ 347
METRIC RANK
10.8%
DISABILITY
99.9/ 100
METRIC RATING
38th/ 347
METRIC RANK
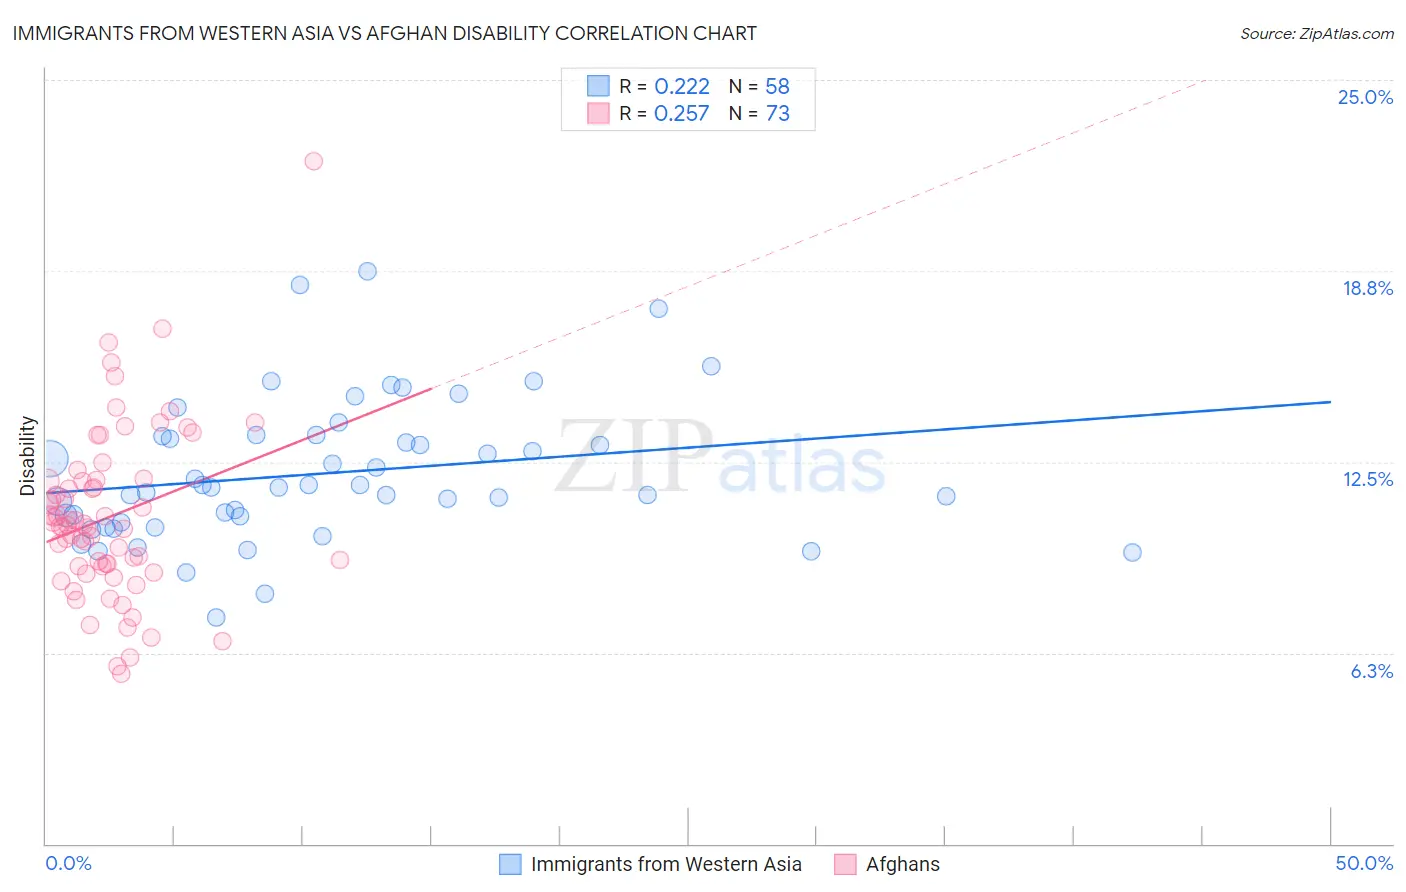
Immigrants from Western Asia vs Afghan Disability Correlation Chart
The statistical analysis conducted on geographies consisting of 404,425,808 people shows a weak positive correlation between the proportion of Immigrants from Western Asia and percentage of population with a disability in the United States with a correlation coefficient (R) of 0.222 and weighted average of 11.2%. Similarly, the statistical analysis conducted on geographies consisting of 148,869,641 people shows a weak positive correlation between the proportion of Afghans and percentage of population with a disability in the United States with a correlation coefficient (R) of 0.257 and weighted average of 10.8%, a difference of 4.0%.
Disability Correlation Summary
| Measurement | Immigrants from Western Asia | Afghan |
| Minimum | 7.4% | 5.6% |
| Maximum | 18.8% | 22.3% |
| Range | 11.4% | 16.8% |
| Mean | 12.1% | 10.7% |
| Median | 11.7% | 10.4% |
| Interquartile 25% (IQ1) | 10.5% | 9.1% |
| Interquartile 75% (IQ3) | 13.4% | 11.9% |
| Interquartile Range (IQR) | 2.8% | 2.8% |
| Standard Deviation (Sample) | 2.3% | 2.8% |
| Standard Deviation (Population) | 2.3% | 2.8% |
Similar Demographics by Disability
Demographics Similar to Immigrants from Western Asia by Disability
In terms of disability, the demographic groups most similar to Immigrants from Western Asia are Immigrants from Brazil (11.2%, a difference of 0.020%), Ecuadorian (11.2%, a difference of 0.040%), Immigrants from Ecuador (11.2%, a difference of 0.040%), Immigrants from South Africa (11.2%, a difference of 0.070%), and Immigrants from Morocco (11.2%, a difference of 0.16%).
| Demographics | Rating | Rank | Disability |
| Immigrants | Sierra Leone | 99.0 /100 | #84 | Exceptional 11.1% |
| Immigrants | Belarus | 98.9 /100 | #85 | Exceptional 11.1% |
| Immigrants | Russia | 98.9 /100 | #86 | Exceptional 11.1% |
| Palestinians | 98.9 /100 | #87 | Exceptional 11.1% |
| Immigrants | Romania | 98.5 /100 | #88 | Exceptional 11.2% |
| Immigrants | South Africa | 98.2 /100 | #89 | Exceptional 11.2% |
| Immigrants | Brazil | 98.1 /100 | #90 | Exceptional 11.2% |
| Immigrants | Western Asia | 98.1 /100 | #91 | Exceptional 11.2% |
| Ecuadorians | 98.0 /100 | #92 | Exceptional 11.2% |
| Immigrants | Ecuador | 98.0 /100 | #93 | Exceptional 11.2% |
| Immigrants | Morocco | 97.8 /100 | #94 | Exceptional 11.2% |
| Eastern Europeans | 97.8 /100 | #95 | Exceptional 11.2% |
| Immigrants | Zimbabwe | 97.7 /100 | #96 | Exceptional 11.2% |
| Bhutanese | 97.4 /100 | #97 | Exceptional 11.2% |
| Uruguayans | 97.4 /100 | #98 | Exceptional 11.2% |
Demographics Similar to Afghans by Disability
In terms of disability, the demographic groups most similar to Afghans are Cambodian (10.8%, a difference of 0.10%), Mongolian (10.8%, a difference of 0.10%), Immigrants from Australia (10.8%, a difference of 0.15%), Immigrants from Nepal (10.8%, a difference of 0.25%), and Israeli (10.8%, a difference of 0.29%).
| Demographics | Rating | Rank | Disability |
| Immigrants | Egypt | 100.0 /100 | #31 | Exceptional 10.6% |
| Paraguayans | 100.0 /100 | #32 | Exceptional 10.6% |
| Immigrants | Kuwait | 100.0 /100 | #33 | Exceptional 10.7% |
| Immigrants | Ethiopia | 100.0 /100 | #34 | Exceptional 10.7% |
| Immigrants | Indonesia | 100.0 /100 | #35 | Exceptional 10.7% |
| Ethiopians | 100.0 /100 | #36 | Exceptional 10.7% |
| Turks | 100.0 /100 | #37 | Exceptional 10.7% |
| Afghans | 99.9 /100 | #38 | Exceptional 10.8% |
| Cambodians | 99.9 /100 | #39 | Exceptional 10.8% |
| Mongolians | 99.9 /100 | #40 | Exceptional 10.8% |
| Immigrants | Australia | 99.9 /100 | #41 | Exceptional 10.8% |
| Immigrants | Nepal | 99.9 /100 | #42 | Exceptional 10.8% |
| Israelis | 99.9 /100 | #43 | Exceptional 10.8% |
| Immigrants | Japan | 99.9 /100 | #44 | Exceptional 10.8% |
| Immigrants | Peru | 99.9 /100 | #45 | Exceptional 10.8% |