Costa Rican vs Afghan Disability
COMPARE
Costa Rican
Afghan
Disability
Disability Comparison
Costa Ricans
Afghans
11.4%
DISABILITY
91.9/ 100
METRIC RATING
125th/ 347
METRIC RANK
10.8%
DISABILITY
99.9/ 100
METRIC RATING
38th/ 347
METRIC RANK
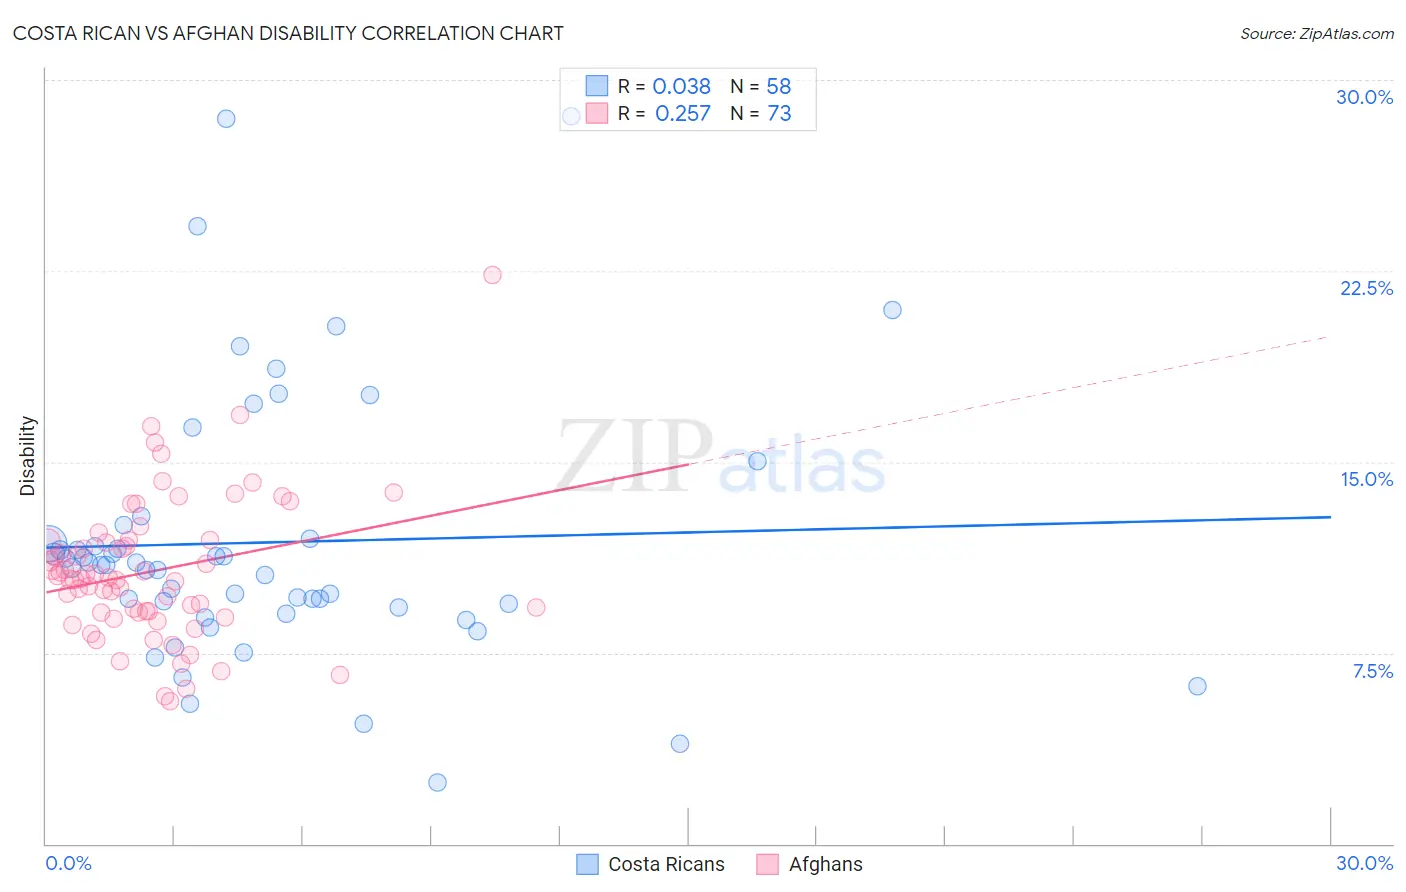
Costa Rican vs Afghan Disability Correlation Chart
The statistical analysis conducted on geographies consisting of 253,574,017 people shows no correlation between the proportion of Costa Ricans and percentage of population with a disability in the United States with a correlation coefficient (R) of 0.038 and weighted average of 11.4%. Similarly, the statistical analysis conducted on geographies consisting of 148,869,641 people shows a weak positive correlation between the proportion of Afghans and percentage of population with a disability in the United States with a correlation coefficient (R) of 0.257 and weighted average of 10.8%, a difference of 5.9%.
Disability Correlation Summary
| Measurement | Costa Rican | Afghan |
| Minimum | 2.4% | 5.6% |
| Maximum | 28.6% | 22.3% |
| Range | 26.2% | 16.8% |
| Mean | 11.8% | 10.7% |
| Median | 10.9% | 10.4% |
| Interquartile 25% (IQ1) | 9.3% | 9.1% |
| Interquartile 75% (IQ3) | 12.0% | 11.9% |
| Interquartile Range (IQR) | 2.7% | 2.8% |
| Standard Deviation (Sample) | 5.2% | 2.8% |
| Standard Deviation (Population) | 5.2% | 2.8% |
Similar Demographics by Disability
Demographics Similar to Costa Ricans by Disability
In terms of disability, the demographic groups most similar to Costa Ricans are South American Indian (11.4%, a difference of 0.040%), South African (11.4%, a difference of 0.060%), Immigrants from Latvia (11.4%, a difference of 0.15%), Immigrants from Italy (11.4%, a difference of 0.22%), and Immigrants from Europe (11.4%, a difference of 0.22%).
| Demographics | Rating | Rank | Disability |
| Koreans | 93.8 /100 | #118 | Exceptional 11.3% |
| Central Americans | 93.5 /100 | #119 | Exceptional 11.4% |
| Immigrants | North Macedonia | 93.5 /100 | #120 | Exceptional 11.4% |
| Immigrants | Costa Rica | 93.4 /100 | #121 | Exceptional 11.4% |
| Brazilians | 93.3 /100 | #122 | Exceptional 11.4% |
| South Africans | 92.3 /100 | #123 | Exceptional 11.4% |
| South American Indians | 92.2 /100 | #124 | Exceptional 11.4% |
| Costa Ricans | 91.9 /100 | #125 | Exceptional 11.4% |
| Immigrants | Latvia | 90.9 /100 | #126 | Exceptional 11.4% |
| Immigrants | Italy | 90.4 /100 | #127 | Exceptional 11.4% |
| Immigrants | Europe | 90.4 /100 | #128 | Exceptional 11.4% |
| Macedonians | 90.3 /100 | #129 | Exceptional 11.4% |
| Latvians | 89.8 /100 | #130 | Excellent 11.4% |
| Immigrants | Croatia | 89.8 /100 | #131 | Excellent 11.4% |
| Immigrants | Africa | 89.3 /100 | #132 | Excellent 11.4% |
Demographics Similar to Afghans by Disability
In terms of disability, the demographic groups most similar to Afghans are Cambodian (10.8%, a difference of 0.10%), Mongolian (10.8%, a difference of 0.10%), Immigrants from Australia (10.8%, a difference of 0.15%), Immigrants from Nepal (10.8%, a difference of 0.25%), and Israeli (10.8%, a difference of 0.29%).
| Demographics | Rating | Rank | Disability |
| Immigrants | Egypt | 100.0 /100 | #31 | Exceptional 10.6% |
| Paraguayans | 100.0 /100 | #32 | Exceptional 10.6% |
| Immigrants | Kuwait | 100.0 /100 | #33 | Exceptional 10.7% |
| Immigrants | Ethiopia | 100.0 /100 | #34 | Exceptional 10.7% |
| Immigrants | Indonesia | 100.0 /100 | #35 | Exceptional 10.7% |
| Ethiopians | 100.0 /100 | #36 | Exceptional 10.7% |
| Turks | 100.0 /100 | #37 | Exceptional 10.7% |
| Afghans | 99.9 /100 | #38 | Exceptional 10.8% |
| Cambodians | 99.9 /100 | #39 | Exceptional 10.8% |
| Mongolians | 99.9 /100 | #40 | Exceptional 10.8% |
| Immigrants | Australia | 99.9 /100 | #41 | Exceptional 10.8% |
| Immigrants | Nepal | 99.9 /100 | #42 | Exceptional 10.8% |
| Israelis | 99.9 /100 | #43 | Exceptional 10.8% |
| Immigrants | Japan | 99.9 /100 | #44 | Exceptional 10.8% |
| Immigrants | Peru | 99.9 /100 | #45 | Exceptional 10.8% |