Houma vs Immigrants from Spain Self-Care Disability
COMPARE
Houma
Immigrants from Spain
Self-Care Disability
Self-Care Disability Comparison
Houma
Immigrants from Spain
3.0%
SELF-CARE DISABILITY
0.0/ 100
METRIC RATING
334th/ 347
METRIC RANK
2.3%
SELF-CARE DISABILITY
98.7/ 100
METRIC RATING
84th/ 347
METRIC RANK
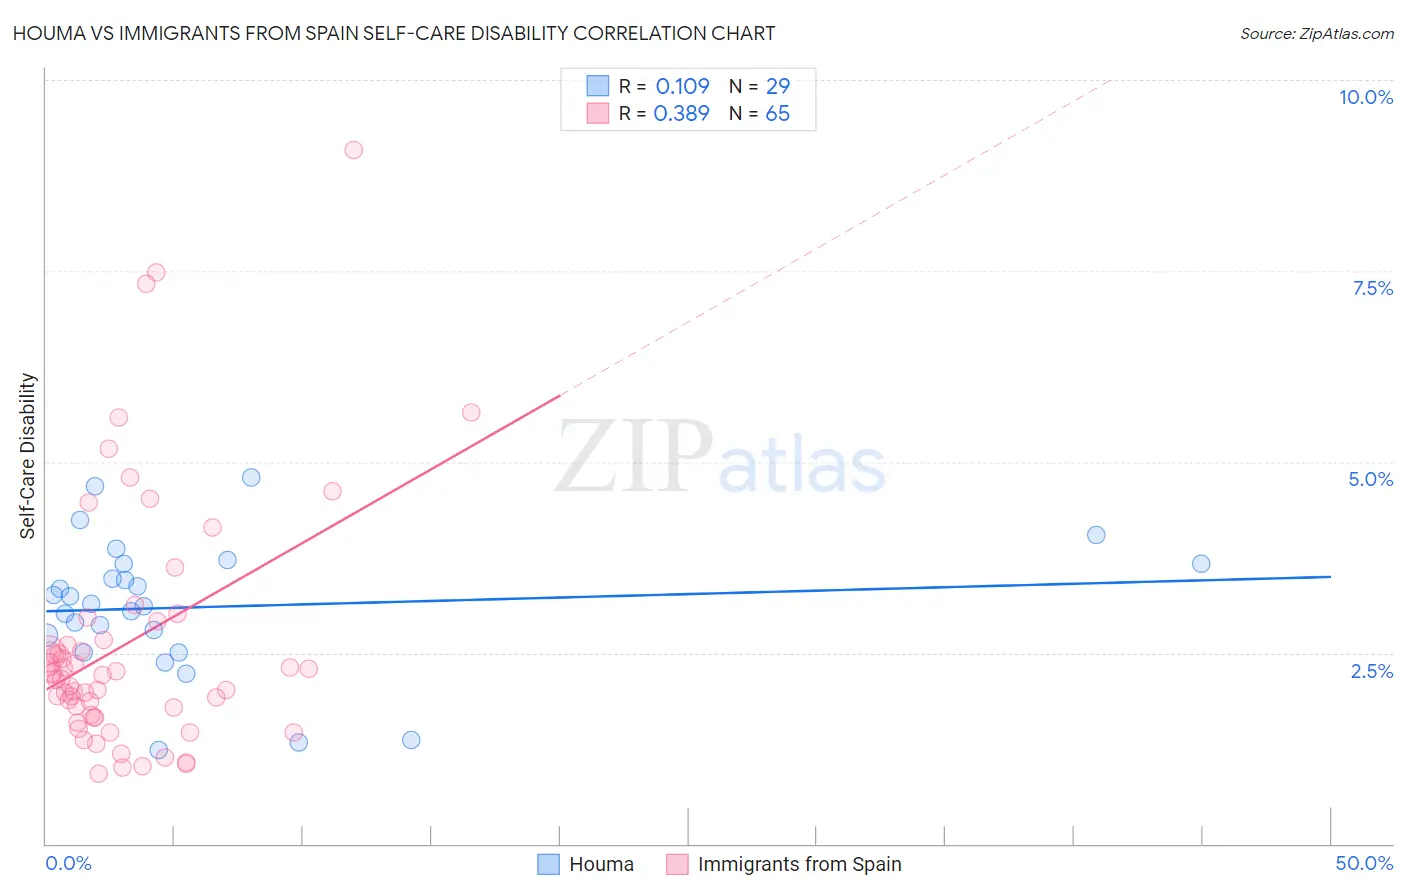
Houma vs Immigrants from Spain Self-Care Disability Correlation Chart
The statistical analysis conducted on geographies consisting of 36,783,442 people shows a poor positive correlation between the proportion of Houma and percentage of population with self-care disability in the United States with a correlation coefficient (R) of 0.109 and weighted average of 3.0%. Similarly, the statistical analysis conducted on geographies consisting of 239,524,195 people shows a mild positive correlation between the proportion of Immigrants from Spain and percentage of population with self-care disability in the United States with a correlation coefficient (R) of 0.389 and weighted average of 2.3%, a difference of 27.6%.
Self-Care Disability Correlation Summary
| Measurement | Houma | Immigrants from Spain |
| Minimum | 1.2% | 0.91% |
| Maximum | 4.8% | 9.1% |
| Range | 3.6% | 8.2% |
| Mean | 3.1% | 2.6% |
| Median | 3.1% | 2.2% |
| Interquartile 25% (IQ1) | 2.6% | 1.7% |
| Interquartile 75% (IQ3) | 3.7% | 2.8% |
| Interquartile Range (IQR) | 1.0% | 1.1% |
| Standard Deviation (Sample) | 0.88% | 1.6% |
| Standard Deviation (Population) | 0.86% | 1.6% |
Similar Demographics by Self-Care Disability
Demographics Similar to Houma by Self-Care Disability
In terms of self-care disability, the demographic groups most similar to Houma are Immigrants from the Azores (3.0%, a difference of 0.050%), Dutch West Indian (3.0%, a difference of 0.070%), Immigrants from Yemen (3.0%, a difference of 0.21%), Kiowa (3.0%, a difference of 0.30%), and Lumbee (3.0%, a difference of 0.66%).
| Demographics | Rating | Rank | Self-Care Disability |
| Blacks/African Americans | 0.0 /100 | #327 | Tragic 2.9% |
| Hopi | 0.0 /100 | #328 | Tragic 2.9% |
| Cajuns | 0.0 /100 | #329 | Tragic 2.9% |
| Nepalese | 0.0 /100 | #330 | Tragic 3.0% |
| Lumbee | 0.0 /100 | #331 | Tragic 3.0% |
| Kiowa | 0.0 /100 | #332 | Tragic 3.0% |
| Dutch West Indians | 0.0 /100 | #333 | Tragic 3.0% |
| Houma | 0.0 /100 | #334 | Tragic 3.0% |
| Immigrants | Azores | 0.0 /100 | #335 | Tragic 3.0% |
| Immigrants | Yemen | 0.0 /100 | #336 | Tragic 3.0% |
| Choctaw | 0.0 /100 | #337 | Tragic 3.0% |
| Cape Verdeans | 0.0 /100 | #338 | Tragic 3.0% |
| Immigrants | Dominican Republic | 0.0 /100 | #339 | Tragic 3.0% |
| Immigrants | Cabo Verde | 0.0 /100 | #340 | Tragic 3.1% |
| Dominicans | 0.0 /100 | #341 | Tragic 3.1% |
Demographics Similar to Immigrants from Spain by Self-Care Disability
In terms of self-care disability, the demographic groups most similar to Immigrants from Spain are Indian (Asian) (2.3%, a difference of 0.040%), Immigrants from Denmark (2.3%, a difference of 0.10%), Ugandan (2.3%, a difference of 0.11%), Chilean (2.3%, a difference of 0.17%), and Estonian (2.3%, a difference of 0.34%).
| Demographics | Rating | Rank | Self-Care Disability |
| Immigrants | Middle Africa | 99.0 /100 | #77 | Exceptional 2.3% |
| Immigrants | Ireland | 99.0 /100 | #78 | Exceptional 2.3% |
| Immigrants | Kenya | 99.0 /100 | #79 | Exceptional 2.3% |
| Chileans | 98.8 /100 | #80 | Exceptional 2.3% |
| Ugandans | 98.8 /100 | #81 | Exceptional 2.3% |
| Immigrants | Denmark | 98.8 /100 | #82 | Exceptional 2.3% |
| Indians (Asian) | 98.7 /100 | #83 | Exceptional 2.3% |
| Immigrants | Spain | 98.7 /100 | #84 | Exceptional 2.3% |
| Estonians | 98.3 /100 | #85 | Exceptional 2.3% |
| Immigrants | Northern Africa | 98.2 /100 | #86 | Exceptional 2.3% |
| Sierra Leoneans | 98.0 /100 | #87 | Exceptional 2.4% |
| Lithuanians | 98.0 /100 | #88 | Exceptional 2.4% |
| Immigrants | Congo | 98.0 /100 | #89 | Exceptional 2.4% |
| Immigrants | Czechoslovakia | 97.7 /100 | #90 | Exceptional 2.4% |
| Immigrants | Jordan | 97.7 /100 | #91 | Exceptional 2.4% |