Immigrants from Micronesia vs Immigrants from Spain Self-Care Disability
COMPARE
Immigrants from Micronesia
Immigrants from Spain
Self-Care Disability
Self-Care Disability Comparison
Immigrants from Micronesia
Immigrants from Spain
2.7%
SELF-CARE DISABILITY
0.1/ 100
METRIC RATING
270th/ 347
METRIC RANK
2.3%
SELF-CARE DISABILITY
98.7/ 100
METRIC RATING
84th/ 347
METRIC RANK
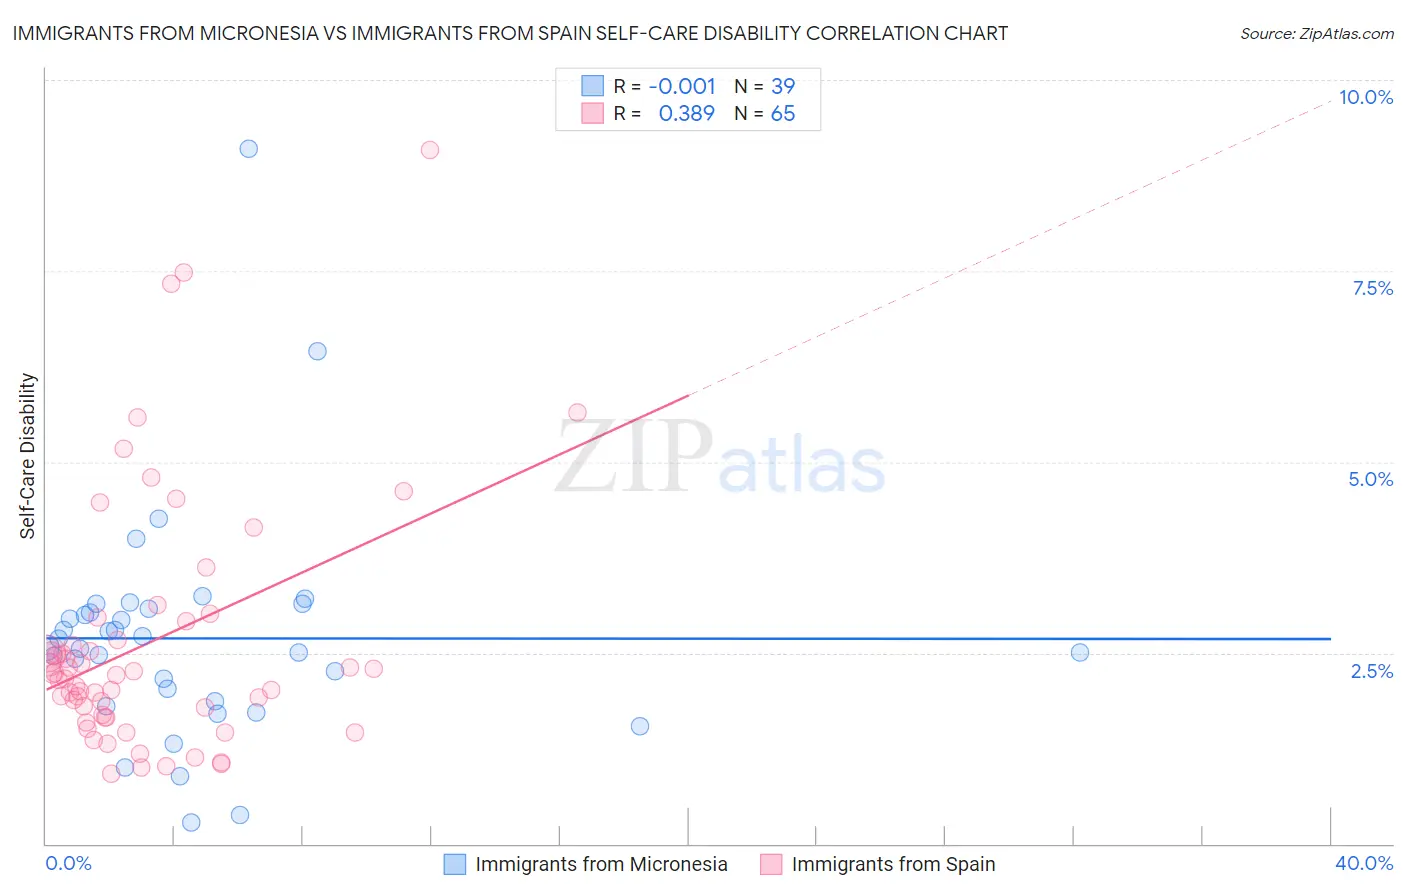
Immigrants from Micronesia vs Immigrants from Spain Self-Care Disability Correlation Chart
The statistical analysis conducted on geographies consisting of 61,544,733 people shows no correlation between the proportion of Immigrants from Micronesia and percentage of population with self-care disability in the United States with a correlation coefficient (R) of -0.001 and weighted average of 2.7%. Similarly, the statistical analysis conducted on geographies consisting of 239,524,195 people shows a mild positive correlation between the proportion of Immigrants from Spain and percentage of population with self-care disability in the United States with a correlation coefficient (R) of 0.389 and weighted average of 2.3%, a difference of 14.1%.
Self-Care Disability Correlation Summary
| Measurement | Immigrants from Micronesia | Immigrants from Spain |
| Minimum | 0.28% | 0.91% |
| Maximum | 9.1% | 9.1% |
| Range | 8.8% | 8.2% |
| Mean | 2.7% | 2.6% |
| Median | 2.6% | 2.2% |
| Interquartile 25% (IQ1) | 1.9% | 1.7% |
| Interquartile 75% (IQ3) | 3.1% | 2.8% |
| Interquartile Range (IQR) | 1.2% | 1.1% |
| Standard Deviation (Sample) | 1.5% | 1.6% |
| Standard Deviation (Population) | 1.5% | 1.6% |
Similar Demographics by Self-Care Disability
Demographics Similar to Immigrants from Micronesia by Self-Care Disability
In terms of self-care disability, the demographic groups most similar to Immigrants from Micronesia are U.S. Virgin Islander (2.7%, a difference of 0.040%), Trinidadian and Tobagonian (2.7%, a difference of 0.060%), Immigrants from Laos (2.7%, a difference of 0.10%), Immigrants from Mexico (2.7%, a difference of 0.21%), and Mexican (2.7%, a difference of 0.24%).
| Demographics | Rating | Rank | Self-Care Disability |
| Immigrants | Latin America | 0.2 /100 | #263 | Tragic 2.7% |
| Immigrants | Iran | 0.2 /100 | #264 | Tragic 2.7% |
| Immigrants | Nicaragua | 0.2 /100 | #265 | Tragic 2.7% |
| Immigrants | Cambodia | 0.1 /100 | #266 | Tragic 2.7% |
| Yaqui | 0.1 /100 | #267 | Tragic 2.7% |
| Immigrants | Mexico | 0.1 /100 | #268 | Tragic 2.7% |
| U.S. Virgin Islanders | 0.1 /100 | #269 | Tragic 2.7% |
| Immigrants | Micronesia | 0.1 /100 | #270 | Tragic 2.7% |
| Trinidadians and Tobagonians | 0.1 /100 | #271 | Tragic 2.7% |
| Immigrants | Laos | 0.1 /100 | #272 | Tragic 2.7% |
| Mexicans | 0.1 /100 | #273 | Tragic 2.7% |
| Yakama | 0.1 /100 | #274 | Tragic 2.7% |
| Immigrants | Trinidad and Tobago | 0.1 /100 | #275 | Tragic 2.7% |
| Japanese | 0.1 /100 | #276 | Tragic 2.7% |
| Immigrants | Ukraine | 0.1 /100 | #277 | Tragic 2.7% |
Demographics Similar to Immigrants from Spain by Self-Care Disability
In terms of self-care disability, the demographic groups most similar to Immigrants from Spain are Indian (Asian) (2.3%, a difference of 0.040%), Immigrants from Denmark (2.3%, a difference of 0.10%), Ugandan (2.3%, a difference of 0.11%), Chilean (2.3%, a difference of 0.17%), and Estonian (2.3%, a difference of 0.34%).
| Demographics | Rating | Rank | Self-Care Disability |
| Immigrants | Middle Africa | 99.0 /100 | #77 | Exceptional 2.3% |
| Immigrants | Ireland | 99.0 /100 | #78 | Exceptional 2.3% |
| Immigrants | Kenya | 99.0 /100 | #79 | Exceptional 2.3% |
| Chileans | 98.8 /100 | #80 | Exceptional 2.3% |
| Ugandans | 98.8 /100 | #81 | Exceptional 2.3% |
| Immigrants | Denmark | 98.8 /100 | #82 | Exceptional 2.3% |
| Indians (Asian) | 98.7 /100 | #83 | Exceptional 2.3% |
| Immigrants | Spain | 98.7 /100 | #84 | Exceptional 2.3% |
| Estonians | 98.3 /100 | #85 | Exceptional 2.3% |
| Immigrants | Northern Africa | 98.2 /100 | #86 | Exceptional 2.3% |
| Sierra Leoneans | 98.0 /100 | #87 | Exceptional 2.4% |
| Lithuanians | 98.0 /100 | #88 | Exceptional 2.4% |
| Immigrants | Congo | 98.0 /100 | #89 | Exceptional 2.4% |
| Immigrants | Czechoslovakia | 97.7 /100 | #90 | Exceptional 2.4% |
| Immigrants | Jordan | 97.7 /100 | #91 | Exceptional 2.4% |