Maltese vs Liberian Self-Care Disability
COMPARE
Maltese
Liberian
Self-Care Disability
Self-Care Disability Comparison
Maltese
Liberians
2.5%
SELF-CARE DISABILITY
37.5/ 100
METRIC RATING
182nd/ 347
METRIC RANK
2.6%
SELF-CARE DISABILITY
2.1/ 100
METRIC RATING
233rd/ 347
METRIC RANK
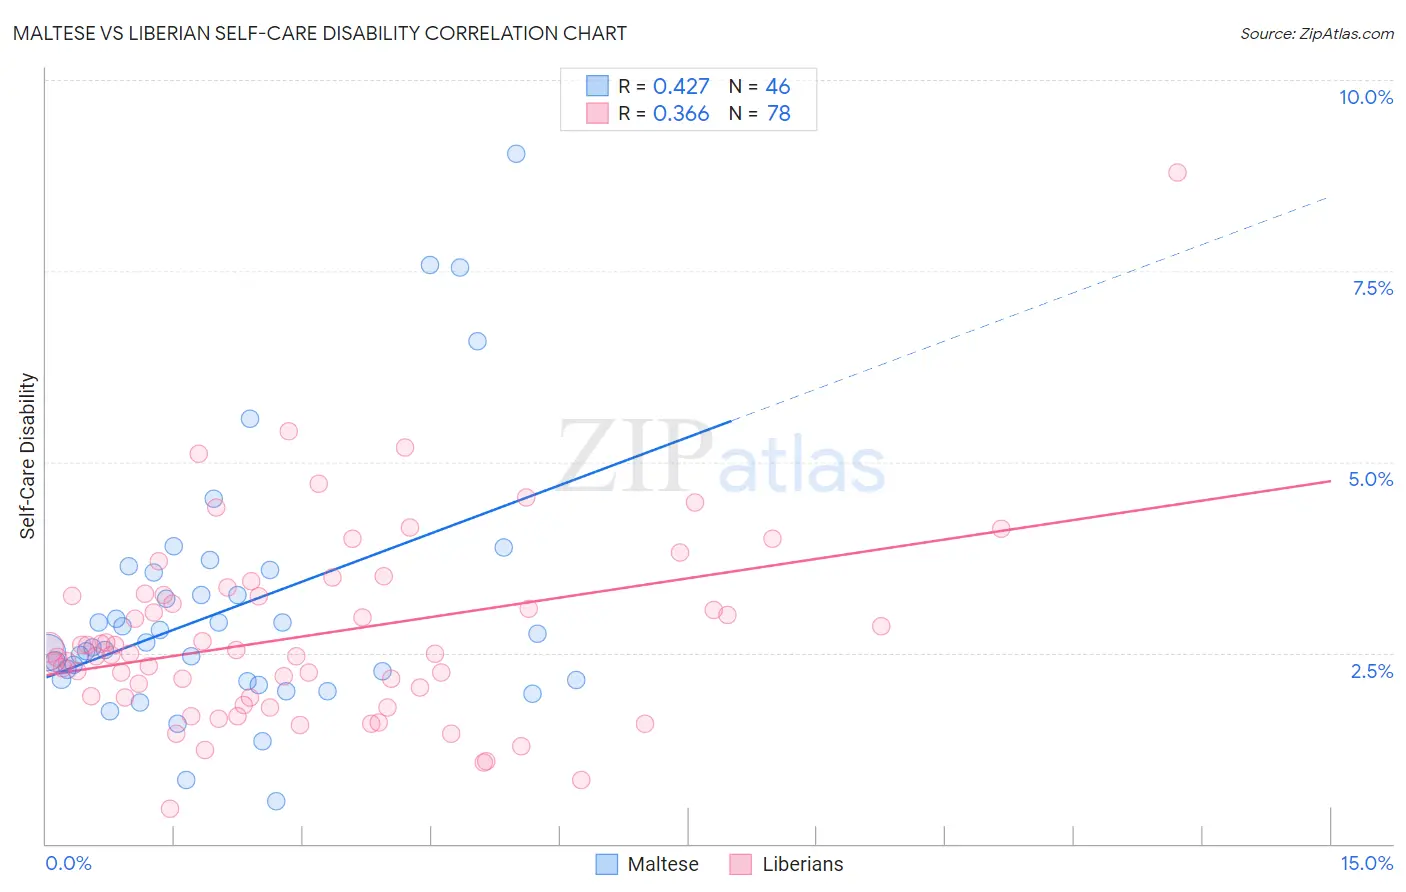
Maltese vs Liberian Self-Care Disability Correlation Chart
The statistical analysis conducted on geographies consisting of 126,446,361 people shows a moderate positive correlation between the proportion of Maltese and percentage of population with self-care disability in the United States with a correlation coefficient (R) of 0.427 and weighted average of 2.5%. Similarly, the statistical analysis conducted on geographies consisting of 117,995,885 people shows a mild positive correlation between the proportion of Liberians and percentage of population with self-care disability in the United States with a correlation coefficient (R) of 0.366 and weighted average of 2.6%, a difference of 3.9%.
Self-Care Disability Correlation Summary
| Measurement | Maltese | Liberian |
| Minimum | 0.56% | 0.46% |
| Maximum | 9.0% | 8.8% |
| Range | 8.5% | 8.3% |
| Mean | 3.1% | 2.7% |
| Median | 2.6% | 2.5% |
| Interquartile 25% (IQ1) | 2.1% | 1.9% |
| Interquartile 75% (IQ3) | 3.5% | 3.2% |
| Interquartile Range (IQR) | 1.4% | 1.3% |
| Standard Deviation (Sample) | 1.7% | 1.3% |
| Standard Deviation (Population) | 1.7% | 1.2% |
Similar Demographics by Self-Care Disability
Demographics Similar to Maltese by Self-Care Disability
In terms of self-care disability, the demographic groups most similar to Maltese are Salvadoran (2.5%, a difference of 0.050%), Yugoslavian (2.5%, a difference of 0.070%), Ghanaian (2.5%, a difference of 0.14%), Slavic (2.5%, a difference of 0.16%), and Indonesian (2.5%, a difference of 0.19%).
| Demographics | Rating | Rank | Self-Care Disability |
| Immigrants | Bosnia and Herzegovina | 49.6 /100 | #175 | Average 2.5% |
| Immigrants | Afghanistan | 47.6 /100 | #176 | Average 2.5% |
| Immigrants | Kazakhstan | 46.7 /100 | #177 | Average 2.5% |
| English | 46.2 /100 | #178 | Average 2.5% |
| Hungarians | 45.5 /100 | #179 | Average 2.5% |
| Indonesians | 41.2 /100 | #180 | Average 2.5% |
| Ghanaians | 40.4 /100 | #181 | Average 2.5% |
| Maltese | 37.5 /100 | #182 | Fair 2.5% |
| Salvadorans | 36.4 /100 | #183 | Fair 2.5% |
| Yugoslavians | 36.1 /100 | #184 | Fair 2.5% |
| Slavs | 34.3 /100 | #185 | Fair 2.5% |
| Immigrants | El Salvador | 33.0 /100 | #186 | Fair 2.5% |
| Irish | 28.7 /100 | #187 | Fair 2.5% |
| Immigrants | Oceania | 28.3 /100 | #188 | Fair 2.5% |
| Immigrants | Eastern Europe | 28.0 /100 | #189 | Fair 2.5% |
Demographics Similar to Liberians by Self-Care Disability
In terms of self-care disability, the demographic groups most similar to Liberians are Vietnamese (2.6%, a difference of 0.010%), Albanian (2.6%, a difference of 0.040%), Bahamian (2.6%, a difference of 0.040%), Immigrants from Guatemala (2.6%, a difference of 0.070%), and Bermudan (2.6%, a difference of 0.11%).
| Demographics | Rating | Rank | Self-Care Disability |
| Chinese | 2.9 /100 | #226 | Tragic 2.6% |
| Immigrants | Philippines | 2.7 /100 | #227 | Tragic 2.6% |
| Guatemalans | 2.7 /100 | #228 | Tragic 2.6% |
| Guamanians/Chamorros | 2.5 /100 | #229 | Tragic 2.6% |
| Immigrants | Ecuador | 2.5 /100 | #230 | Tragic 2.6% |
| Immigrants | Guatemala | 2.2 /100 | #231 | Tragic 2.6% |
| Albanians | 2.2 /100 | #232 | Tragic 2.6% |
| Liberians | 2.1 /100 | #233 | Tragic 2.6% |
| Vietnamese | 2.1 /100 | #234 | Tragic 2.6% |
| Bahamians | 2.0 /100 | #235 | Tragic 2.6% |
| Bermudans | 1.9 /100 | #236 | Tragic 2.6% |
| Immigrants | Senegal | 1.6 /100 | #237 | Tragic 2.6% |
| Senegalese | 1.3 /100 | #238 | Tragic 2.6% |
| Immigrants | Panama | 1.2 /100 | #239 | Tragic 2.6% |
| Marshallese | 1.2 /100 | #240 | Tragic 2.6% |