Samoan vs Liberian Bachelor's Degree
COMPARE
Samoan
Liberian
Bachelor's Degree
Bachelor's Degree Comparison
Samoans
Liberians
31.8%
BACHELOR'S DEGREE
0.1/ 100
METRIC RATING
275th/ 347
METRIC RANK
34.6%
BACHELOR'S DEGREE
2.8/ 100
METRIC RATING
236th/ 347
METRIC RANK
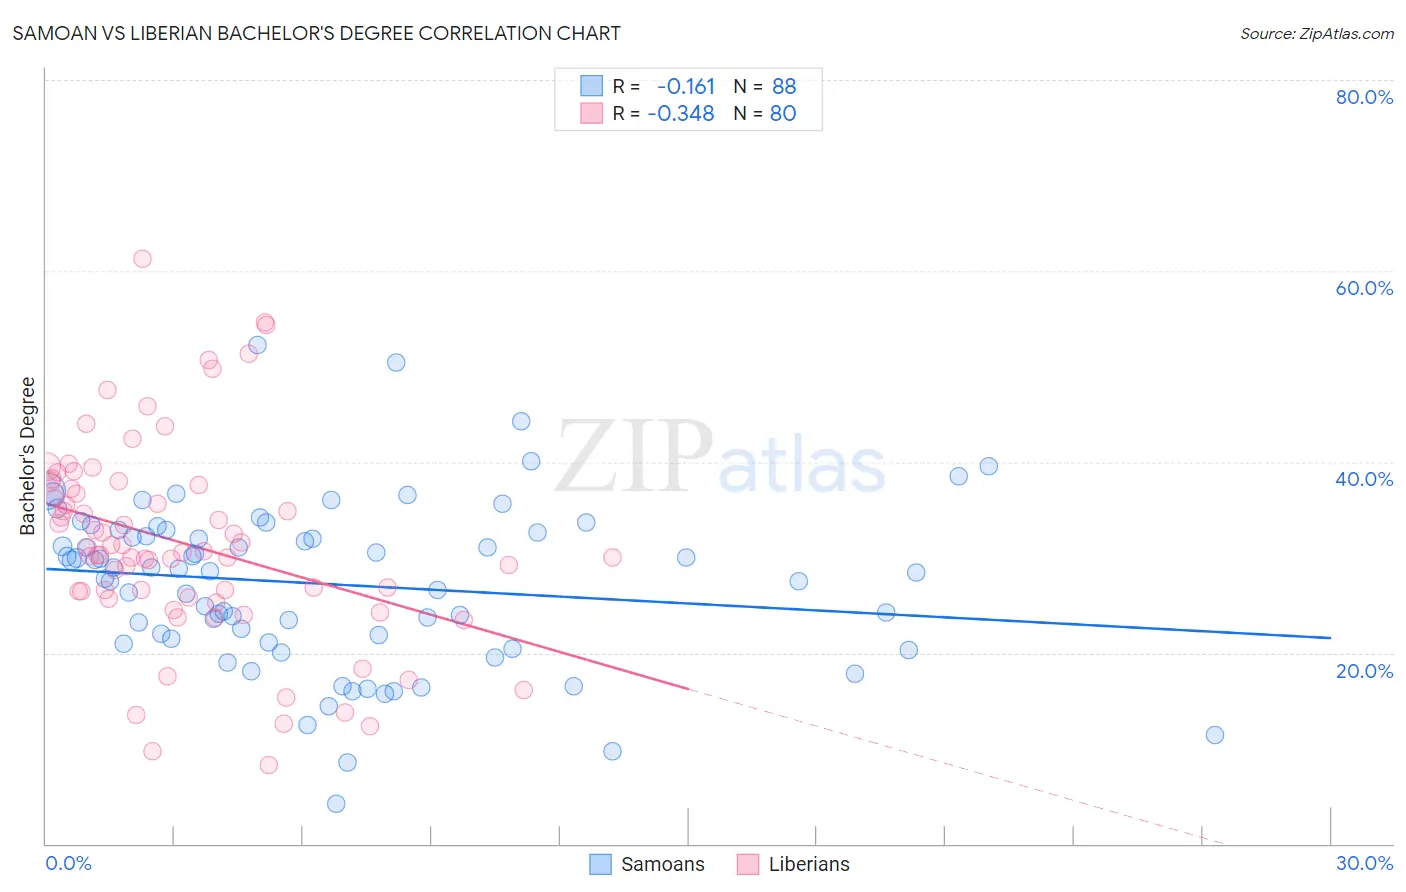
Samoan vs Liberian Bachelor's Degree Correlation Chart
The statistical analysis conducted on geographies consisting of 225,194,746 people shows a poor negative correlation between the proportion of Samoans and percentage of population with at least bachelor's degree education in the United States with a correlation coefficient (R) of -0.161 and weighted average of 31.8%. Similarly, the statistical analysis conducted on geographies consisting of 118,099,075 people shows a mild negative correlation between the proportion of Liberians and percentage of population with at least bachelor's degree education in the United States with a correlation coefficient (R) of -0.348 and weighted average of 34.6%, a difference of 8.7%.
Bachelor's Degree Correlation Summary
| Measurement | Samoan | Liberian |
| Minimum | 4.2% | 8.2% |
| Maximum | 52.2% | 61.3% |
| Range | 48.0% | 53.0% |
| Mean | 27.2% | 31.5% |
| Median | 28.7% | 30.6% |
| Interquartile 25% (IQ1) | 21.2% | 26.1% |
| Interquartile 75% (IQ3) | 32.7% | 37.3% |
| Interquartile Range (IQR) | 11.5% | 11.2% |
| Standard Deviation (Sample) | 8.7% | 10.5% |
| Standard Deviation (Population) | 8.6% | 10.4% |
Similar Demographics by Bachelor's Degree
Demographics Similar to Samoans by Bachelor's Degree
In terms of bachelor's degree, the demographic groups most similar to Samoans are Salvadoran (31.8%, a difference of 0.040%), Potawatomi (31.9%, a difference of 0.13%), American (31.9%, a difference of 0.15%), Dominican (31.8%, a difference of 0.19%), and Marshallese (31.7%, a difference of 0.24%).
| Demographics | Rating | Rank | Bachelor's Degree |
| Immigrants | Portugal | 0.2 /100 | #268 | Tragic 32.2% |
| Immigrants | Belize | 0.2 /100 | #269 | Tragic 32.1% |
| Immigrants | Nicaragua | 0.2 /100 | #270 | Tragic 31.9% |
| Central Americans | 0.2 /100 | #271 | Tragic 31.9% |
| Comanche | 0.2 /100 | #272 | Tragic 31.9% |
| Americans | 0.2 /100 | #273 | Tragic 31.9% |
| Potawatomi | 0.2 /100 | #274 | Tragic 31.9% |
| Samoans | 0.1 /100 | #275 | Tragic 31.8% |
| Salvadorans | 0.1 /100 | #276 | Tragic 31.8% |
| Dominicans | 0.1 /100 | #277 | Tragic 31.8% |
| Marshallese | 0.1 /100 | #278 | Tragic 31.7% |
| Hawaiians | 0.1 /100 | #279 | Tragic 31.6% |
| Immigrants | Laos | 0.1 /100 | #280 | Tragic 31.6% |
| Blackfeet | 0.1 /100 | #281 | Tragic 31.5% |
| Immigrants | Caribbean | 0.1 /100 | #282 | Tragic 31.4% |
Demographics Similar to Liberians by Bachelor's Degree
In terms of bachelor's degree, the demographic groups most similar to Liberians are Tlingit-Haida (34.6%, a difference of 0.040%), Immigrants from West Indies (34.6%, a difference of 0.11%), Guamanian/Chamorro (34.6%, a difference of 0.20%), Guyanese (34.5%, a difference of 0.32%), and British West Indian (34.5%, a difference of 0.34%).
| Demographics | Rating | Rank | Bachelor's Degree |
| Whites/Caucasians | 5.9 /100 | #229 | Tragic 35.3% |
| Immigrants | Grenada | 4.3 /100 | #230 | Tragic 35.0% |
| Immigrants | St. Vincent and the Grenadines | 4.3 /100 | #231 | Tragic 35.0% |
| Hmong | 3.4 /100 | #232 | Tragic 34.8% |
| Immigrants | Ecuador | 3.3 /100 | #233 | Tragic 34.7% |
| Guamanians/Chamorros | 3.0 /100 | #234 | Tragic 34.6% |
| Immigrants | West Indies | 2.9 /100 | #235 | Tragic 34.6% |
| Liberians | 2.8 /100 | #236 | Tragic 34.6% |
| Tlingit-Haida | 2.8 /100 | #237 | Tragic 34.6% |
| Guyanese | 2.5 /100 | #238 | Tragic 34.5% |
| British West Indians | 2.5 /100 | #239 | Tragic 34.5% |
| Tongans | 2.0 /100 | #240 | Tragic 34.3% |
| Immigrants | Cambodia | 1.9 /100 | #241 | Tragic 34.2% |
| Immigrants | Nonimmigrants | 1.8 /100 | #242 | Tragic 34.2% |
| Immigrants | Guyana | 1.4 /100 | #243 | Tragic 33.9% |