Immigrants from Turkey vs Liberian Self-Care Disability
COMPARE
Immigrants from Turkey
Liberian
Self-Care Disability
Self-Care Disability Comparison
Immigrants from Turkey
Liberians
2.3%
SELF-CARE DISABILITY
99.9/ 100
METRIC RATING
34th/ 347
METRIC RANK
2.6%
SELF-CARE DISABILITY
2.1/ 100
METRIC RATING
233rd/ 347
METRIC RANK
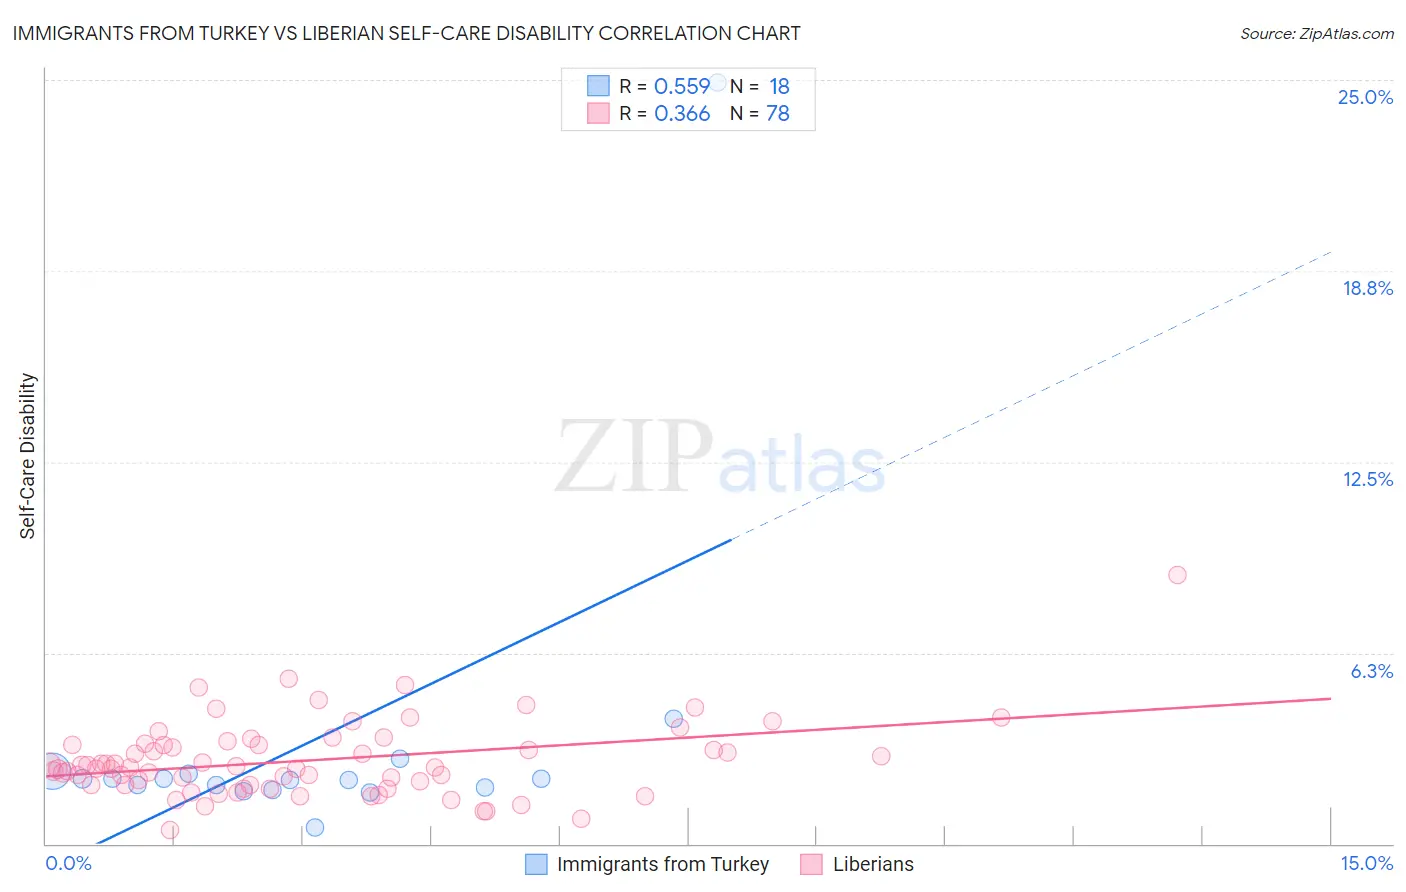
Immigrants from Turkey vs Liberian Self-Care Disability Correlation Chart
The statistical analysis conducted on geographies consisting of 222,915,047 people shows a substantial positive correlation between the proportion of Immigrants from Turkey and percentage of population with self-care disability in the United States with a correlation coefficient (R) of 0.559 and weighted average of 2.3%. Similarly, the statistical analysis conducted on geographies consisting of 117,995,885 people shows a mild positive correlation between the proportion of Liberians and percentage of population with self-care disability in the United States with a correlation coefficient (R) of 0.366 and weighted average of 2.6%, a difference of 13.8%.
Self-Care Disability Correlation Summary
| Measurement | Immigrants from Turkey | Liberian |
| Minimum | 0.52% | 0.46% |
| Maximum | 24.9% | 8.8% |
| Range | 24.4% | 8.3% |
| Mean | 3.4% | 2.7% |
| Median | 2.1% | 2.5% |
| Interquartile 25% (IQ1) | 1.8% | 1.9% |
| Interquartile 75% (IQ3) | 2.3% | 3.2% |
| Interquartile Range (IQR) | 0.47% | 1.3% |
| Standard Deviation (Sample) | 5.4% | 1.3% |
| Standard Deviation (Population) | 5.3% | 1.2% |
Similar Demographics by Self-Care Disability
Demographics Similar to Immigrants from Turkey by Self-Care Disability
In terms of self-care disability, the demographic groups most similar to Immigrants from Turkey are Immigrants from Korea (2.3%, a difference of 0.060%), Immigrants from Australia (2.3%, a difference of 0.060%), Immigrants from Lithuania (2.3%, a difference of 0.070%), Immigrants from Sweden (2.3%, a difference of 0.24%), and Burmese (2.3%, a difference of 0.29%).
| Demographics | Rating | Rank | Self-Care Disability |
| Venezuelans | 99.9 /100 | #27 | Exceptional 2.2% |
| Inupiat | 99.9 /100 | #28 | Exceptional 2.2% |
| Immigrants | Zimbabwe | 99.9 /100 | #29 | Exceptional 2.3% |
| Paraguayans | 99.9 /100 | #30 | Exceptional 2.3% |
| Danes | 99.9 /100 | #31 | Exceptional 2.3% |
| Burmese | 99.9 /100 | #32 | Exceptional 2.3% |
| Immigrants | Korea | 99.9 /100 | #33 | Exceptional 2.3% |
| Immigrants | Turkey | 99.9 /100 | #34 | Exceptional 2.3% |
| Immigrants | Australia | 99.9 /100 | #35 | Exceptional 2.3% |
| Immigrants | Lithuania | 99.9 /100 | #36 | Exceptional 2.3% |
| Immigrants | Sweden | 99.9 /100 | #37 | Exceptional 2.3% |
| Immigrants | Eastern Africa | 99.9 /100 | #38 | Exceptional 2.3% |
| Immigrants | Bulgaria | 99.8 /100 | #39 | Exceptional 2.3% |
| Iranians | 99.8 /100 | #40 | Exceptional 2.3% |
| Immigrants | Sudan | 99.8 /100 | #41 | Exceptional 2.3% |
Demographics Similar to Liberians by Self-Care Disability
In terms of self-care disability, the demographic groups most similar to Liberians are Vietnamese (2.6%, a difference of 0.010%), Albanian (2.6%, a difference of 0.040%), Bahamian (2.6%, a difference of 0.040%), Immigrants from Guatemala (2.6%, a difference of 0.070%), and Bermudan (2.6%, a difference of 0.11%).
| Demographics | Rating | Rank | Self-Care Disability |
| Chinese | 2.9 /100 | #226 | Tragic 2.6% |
| Immigrants | Philippines | 2.7 /100 | #227 | Tragic 2.6% |
| Guatemalans | 2.7 /100 | #228 | Tragic 2.6% |
| Guamanians/Chamorros | 2.5 /100 | #229 | Tragic 2.6% |
| Immigrants | Ecuador | 2.5 /100 | #230 | Tragic 2.6% |
| Immigrants | Guatemala | 2.2 /100 | #231 | Tragic 2.6% |
| Albanians | 2.2 /100 | #232 | Tragic 2.6% |
| Liberians | 2.1 /100 | #233 | Tragic 2.6% |
| Vietnamese | 2.1 /100 | #234 | Tragic 2.6% |
| Bahamians | 2.0 /100 | #235 | Tragic 2.6% |
| Bermudans | 1.9 /100 | #236 | Tragic 2.6% |
| Immigrants | Senegal | 1.6 /100 | #237 | Tragic 2.6% |
| Senegalese | 1.3 /100 | #238 | Tragic 2.6% |
| Immigrants | Panama | 1.2 /100 | #239 | Tragic 2.6% |
| Marshallese | 1.2 /100 | #240 | Tragic 2.6% |