Samoan vs Hispanic or Latino Male Disability
COMPARE
Samoan
Hispanic or Latino
Male Disability
Male Disability Comparison
Samoans
Hispanics or Latinos
11.9%
MALE DISABILITY
1.1/ 100
METRIC RATING
243rd/ 347
METRIC RANK
11.8%
MALE DISABILITY
2.3/ 100
METRIC RATING
228th/ 347
METRIC RANK
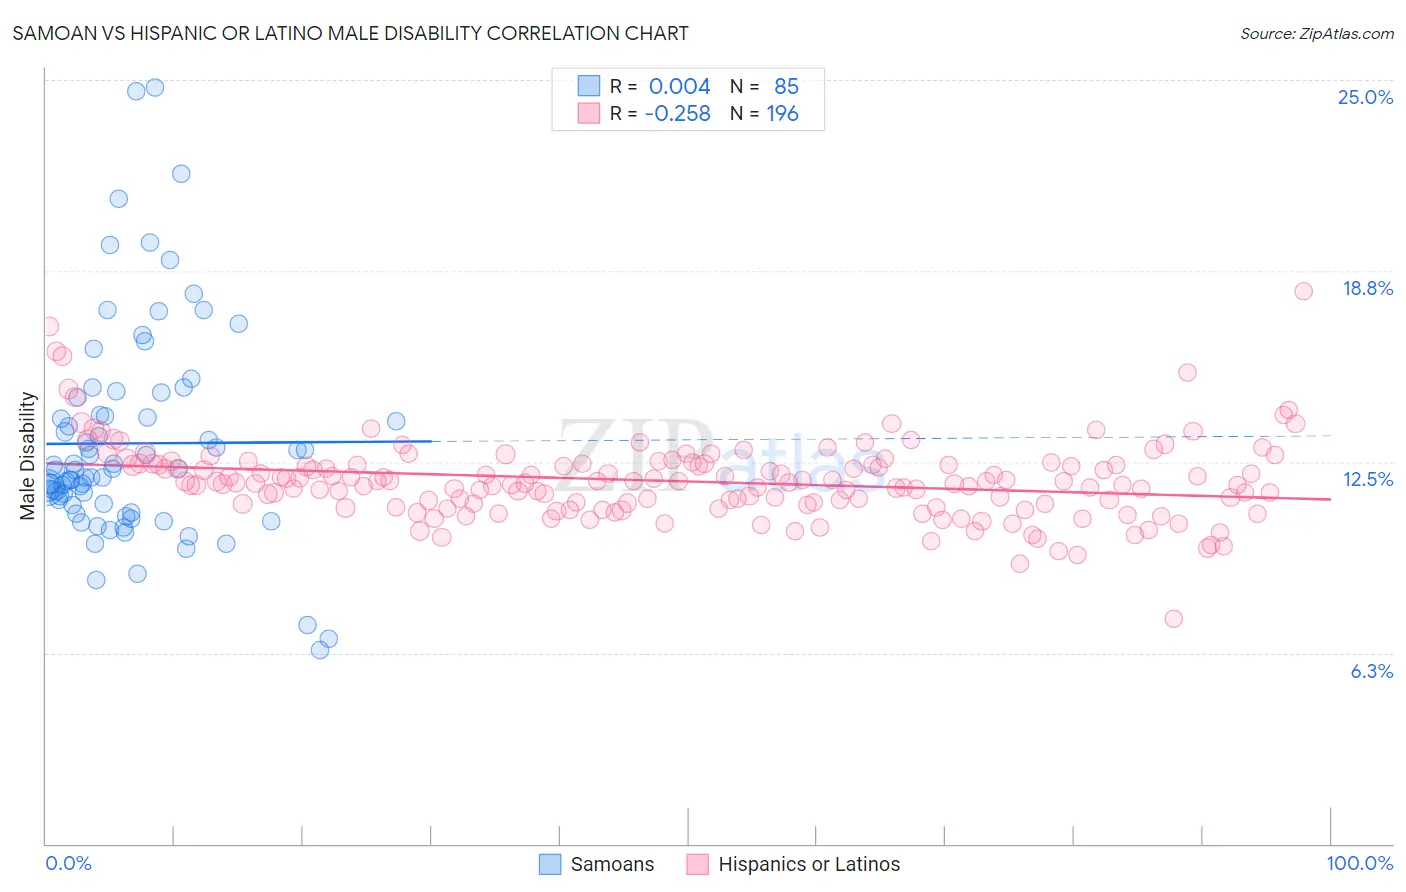
Samoan vs Hispanic or Latino Male Disability Correlation Chart
The statistical analysis conducted on geographies consisting of 225,113,160 people shows no correlation between the proportion of Samoans and percentage of males with a disability in the United States with a correlation coefficient (R) of 0.004 and weighted average of 11.9%. Similarly, the statistical analysis conducted on geographies consisting of 573,649,400 people shows a weak negative correlation between the proportion of Hispanics or Latinos and percentage of males with a disability in the United States with a correlation coefficient (R) of -0.258 and weighted average of 11.8%, a difference of 1.1%.
Male Disability Correlation Summary
| Measurement | Samoan | Hispanic or Latino |
| Minimum | 6.3% | 7.3% |
| Maximum | 24.8% | 18.1% |
| Range | 18.4% | 10.7% |
| Mean | 13.1% | 11.9% |
| Median | 12.2% | 11.8% |
| Interquartile 25% (IQ1) | 11.1% | 11.1% |
| Interquartile 75% (IQ3) | 14.3% | 12.4% |
| Interquartile Range (IQR) | 3.2% | 1.3% |
| Standard Deviation (Sample) | 3.5% | 1.3% |
| Standard Deviation (Population) | 3.5% | 1.3% |
Demographics Similar to Samoans and Hispanics or Latinos by Male Disability
In terms of male disability, the demographic groups most similar to Samoans are Northern European (11.9%, a difference of 0.030%), Bahamian (11.9%, a difference of 0.040%), Czech (11.9%, a difference of 0.080%), Immigrants from Laos (11.9%, a difference of 0.11%), and Immigrants from Liberia (11.9%, a difference of 0.12%). Similarly, the demographic groups most similar to Hispanics or Latinos are Bermudan (11.8%, a difference of 0.030%), Austrian (11.8%, a difference of 0.080%), Croatian (11.8%, a difference of 0.12%), Subsaharan African (11.8%, a difference of 0.26%), and Dominican (11.8%, a difference of 0.32%).
| Demographics | Rating | Rank | Male Disability |
| Liberians | 3.1 /100 | #225 | Tragic 11.8% |
| Sub-Saharan Africans | 2.8 /100 | #226 | Tragic 11.8% |
| Austrians | 2.5 /100 | #227 | Tragic 11.8% |
| Hispanics or Latinos | 2.3 /100 | #228 | Tragic 11.8% |
| Bermudans | 2.3 /100 | #229 | Tragic 11.8% |
| Croatians | 2.1 /100 | #230 | Tragic 11.8% |
| Dominicans | 1.8 /100 | #231 | Tragic 11.8% |
| Malaysians | 1.8 /100 | #232 | Tragic 11.8% |
| Mexicans | 1.7 /100 | #233 | Tragic 11.8% |
| Immigrants | Canada | 1.6 /100 | #234 | Tragic 11.9% |
| Immigrants | North America | 1.5 /100 | #235 | Tragic 11.9% |
| U.S. Virgin Islanders | 1.3 /100 | #236 | Tragic 11.9% |
| Carpatho Rusyns | 1.3 /100 | #237 | Tragic 11.9% |
| Yugoslavians | 1.2 /100 | #238 | Tragic 11.9% |
| Italians | 1.2 /100 | #239 | Tragic 11.9% |
| Czechs | 1.1 /100 | #240 | Tragic 11.9% |
| Bahamians | 1.1 /100 | #241 | Tragic 11.9% |
| Northern Europeans | 1.1 /100 | #242 | Tragic 11.9% |
| Samoans | 1.1 /100 | #243 | Tragic 11.9% |
| Immigrants | Laos | 1.0 /100 | #244 | Tragic 11.9% |
| Immigrants | Liberia | 1.0 /100 | #245 | Tragic 11.9% |