Samoan vs Hispanic or Latino Currently Married
COMPARE
Samoan
Hispanic or Latino
Currently Married
Currently Married Comparison
Samoans
Hispanics or Latinos
46.8%
CURRENTLY MARRIED
59.8/ 100
METRIC RATING
165th/ 347
METRIC RANK
44.1%
CURRENTLY MARRIED
0.3/ 100
METRIC RATING
252nd/ 347
METRIC RANK
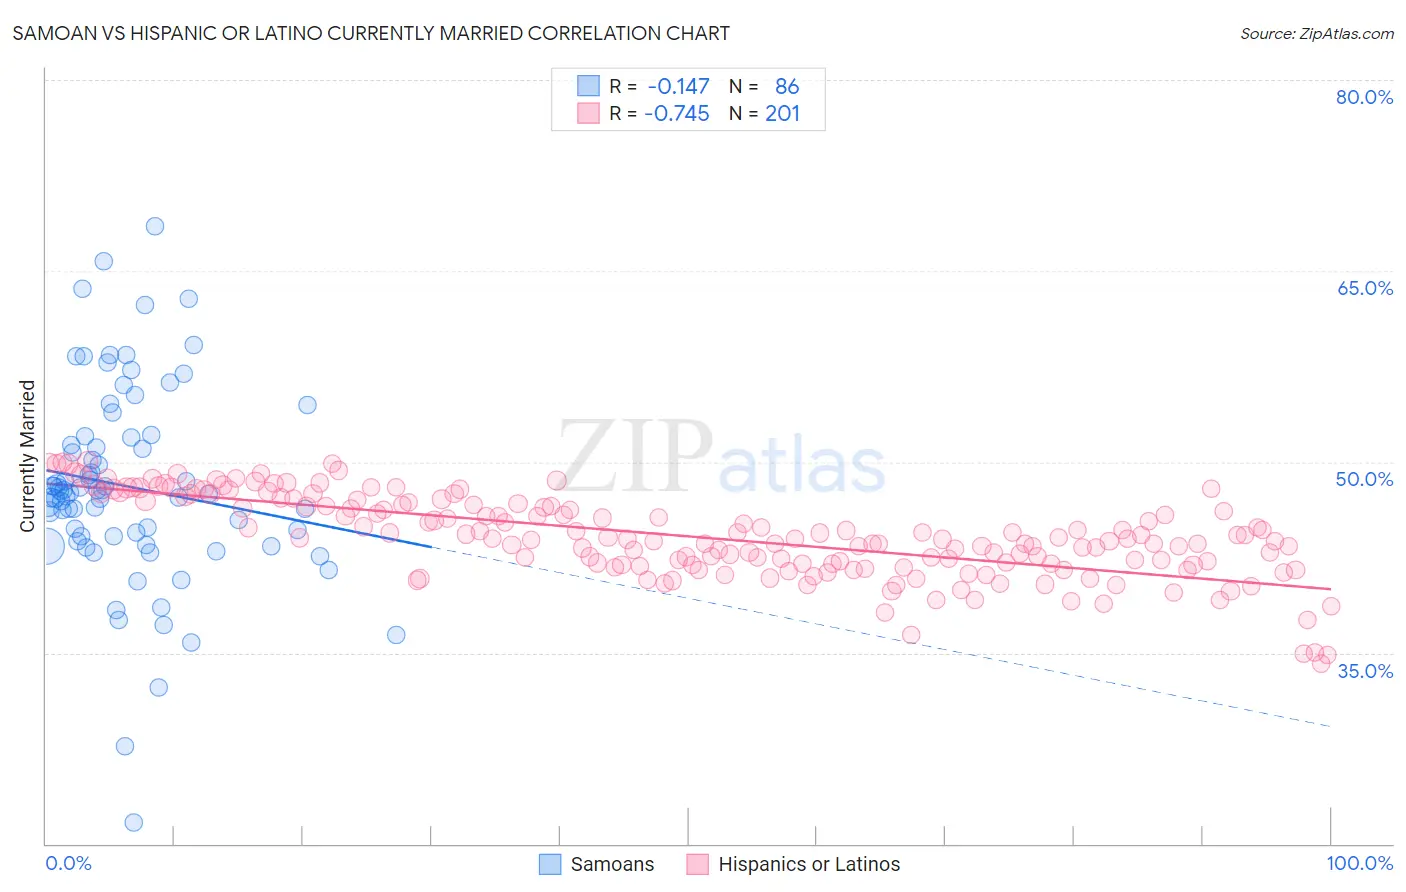
Samoan vs Hispanic or Latino Currently Married Correlation Chart
The statistical analysis conducted on geographies consisting of 225,188,155 people shows a poor negative correlation between the proportion of Samoans and percentage of population currently married in the United States with a correlation coefficient (R) of -0.147 and weighted average of 46.8%. Similarly, the statistical analysis conducted on geographies consisting of 578,461,581 people shows a strong negative correlation between the proportion of Hispanics or Latinos and percentage of population currently married in the United States with a correlation coefficient (R) of -0.745 and weighted average of 44.1%, a difference of 6.0%.
Currently Married Correlation Summary
| Measurement | Samoan | Hispanic or Latino |
| Minimum | 21.7% | 34.1% |
| Maximum | 68.5% | 50.1% |
| Range | 46.8% | 16.0% |
| Mean | 48.1% | 44.1% |
| Median | 47.6% | 44.0% |
| Interquartile 25% (IQ1) | 44.1% | 42.0% |
| Interquartile 75% (IQ3) | 51.9% | 46.8% |
| Interquartile Range (IQR) | 7.8% | 4.8% |
| Standard Deviation (Sample) | 7.8% | 3.2% |
| Standard Deviation (Population) | 7.7% | 3.2% |
Similar Demographics by Currently Married
Demographics Similar to Samoans by Currently Married
In terms of currently married, the demographic groups most similar to Samoans are Immigrants from Syria (46.8%, a difference of 0.020%), Spaniard (46.8%, a difference of 0.040%), Immigrants from Afghanistan (46.8%, a difference of 0.060%), Armenian (46.8%, a difference of 0.060%), and Immigrants from Latvia (46.7%, a difference of 0.11%).
| Demographics | Rating | Rank | Currently Married |
| Cherokee | 66.8 /100 | #158 | Good 46.9% |
| Iraqis | 66.4 /100 | #159 | Good 46.9% |
| Immigrants | Uzbekistan | 66.0 /100 | #160 | Good 46.9% |
| Immigrants | Southern Europe | 65.9 /100 | #161 | Good 46.9% |
| Immigrants | Nonimmigrants | 65.4 /100 | #162 | Good 46.9% |
| Delaware | 64.7 /100 | #163 | Good 46.9% |
| Immigrants | Western Asia | 64.2 /100 | #164 | Good 46.9% |
| Samoans | 59.8 /100 | #165 | Average 46.8% |
| Immigrants | Syria | 59.3 /100 | #166 | Average 46.8% |
| Spaniards | 58.8 /100 | #167 | Average 46.8% |
| Immigrants | Afghanistan | 58.2 /100 | #168 | Average 46.8% |
| Armenians | 58.2 /100 | #169 | Average 46.8% |
| Immigrants | Latvia | 56.7 /100 | #170 | Average 46.7% |
| Immigrants | Zimbabwe | 52.4 /100 | #171 | Average 46.7% |
| Aleuts | 52.0 /100 | #172 | Average 46.7% |
Demographics Similar to Hispanics or Latinos by Currently Married
In terms of currently married, the demographic groups most similar to Hispanics or Latinos are Blackfeet (44.2%, a difference of 0.020%), Immigrants from Central America (44.1%, a difference of 0.030%), Immigrants from Eastern Africa (44.2%, a difference of 0.080%), Immigrants from Cameroon (44.2%, a difference of 0.11%), and Nicaraguan (44.2%, a difference of 0.12%).
| Demographics | Rating | Rank | Currently Married |
| Immigrants | Armenia | 0.4 /100 | #245 | Tragic 44.3% |
| Immigrants | Burma/Myanmar | 0.4 /100 | #246 | Tragic 44.3% |
| Ugandans | 0.4 /100 | #247 | Tragic 44.2% |
| Nicaraguans | 0.3 /100 | #248 | Tragic 44.2% |
| Immigrants | Cameroon | 0.3 /100 | #249 | Tragic 44.2% |
| Immigrants | Eastern Africa | 0.3 /100 | #250 | Tragic 44.2% |
| Blackfeet | 0.3 /100 | #251 | Tragic 44.2% |
| Hispanics or Latinos | 0.3 /100 | #252 | Tragic 44.1% |
| Immigrants | Central America | 0.3 /100 | #253 | Tragic 44.1% |
| Vietnamese | 0.2 /100 | #254 | Tragic 44.0% |
| Yakama | 0.2 /100 | #255 | Tragic 44.0% |
| Shoshone | 0.2 /100 | #256 | Tragic 44.0% |
| Immigrants | Africa | 0.2 /100 | #257 | Tragic 43.9% |
| Ute | 0.2 /100 | #258 | Tragic 43.9% |
| Immigrants | Sierra Leone | 0.1 /100 | #259 | Tragic 43.8% |