Scottish vs Hispanic or Latino Disability Age 5 to 17
COMPARE
Scottish
Hispanic or Latino
Disability Age 5 to 17
Disability Age 5 to 17 Comparison
Scottish
Hispanics or Latinos
6.1%
DISABILITY AGE 5 TO 17
0.0/ 100
METRIC RATING
281st/ 347
METRIC RANK
5.9%
DISABILITY AGE 5 TO 17
1.0/ 100
METRIC RATING
257th/ 347
METRIC RANK
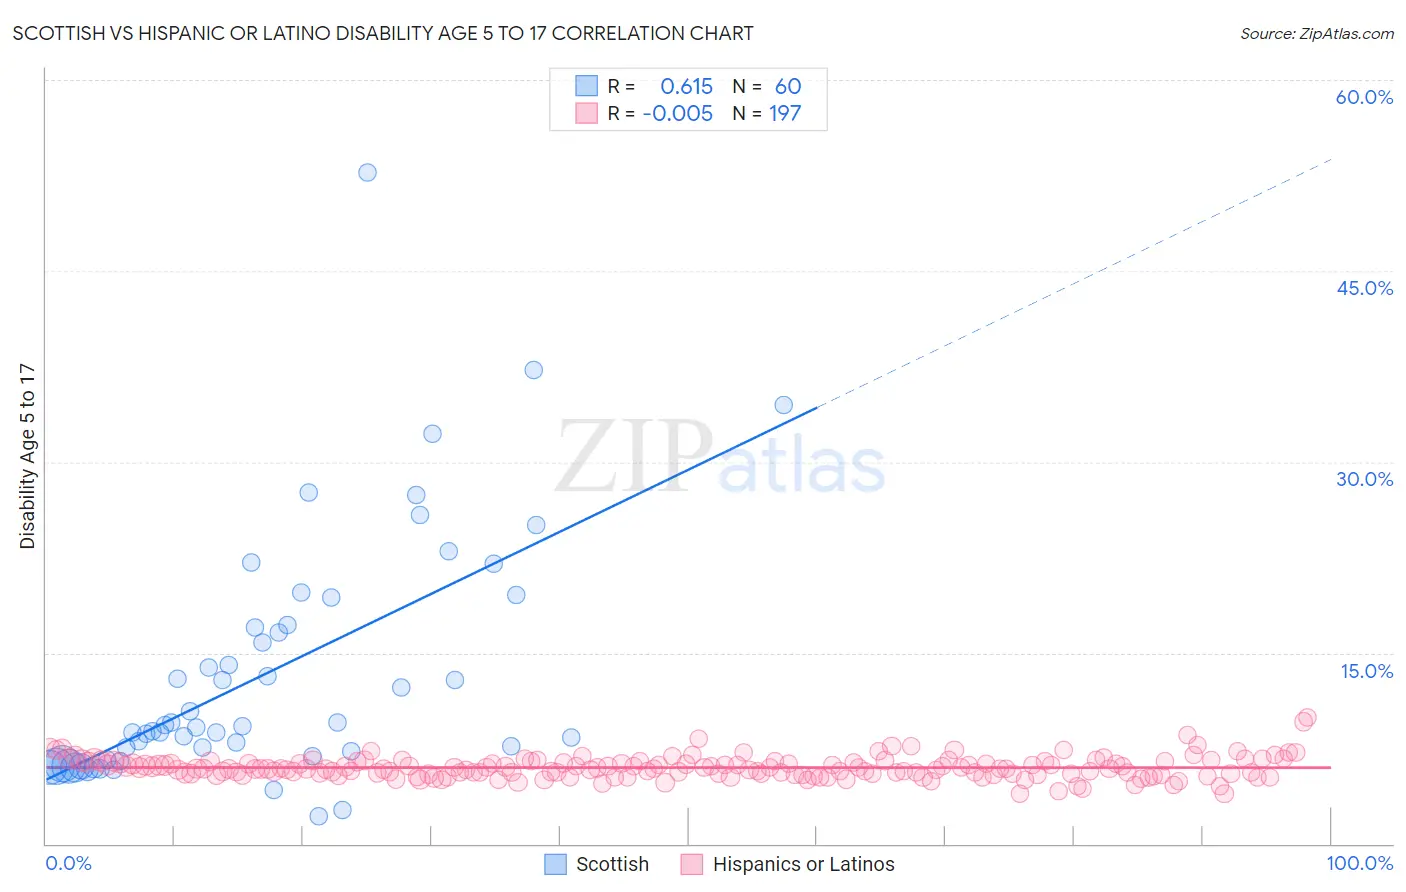
Scottish vs Hispanic or Latino Disability Age 5 to 17 Correlation Chart
The statistical analysis conducted on geographies consisting of 553,365,795 people shows a significant positive correlation between the proportion of Scottish and percentage of population with a disability between the ages 5 and 17 in the United States with a correlation coefficient (R) of 0.615 and weighted average of 6.1%. Similarly, the statistical analysis conducted on geographies consisting of 559,956,499 people shows no correlation between the proportion of Hispanics or Latinos and percentage of population with a disability between the ages 5 and 17 in the United States with a correlation coefficient (R) of -0.005 and weighted average of 5.9%, a difference of 3.6%.
Disability Age 5 to 17 Correlation Summary
| Measurement | Scottish | Hispanic or Latino |
| Minimum | 2.1% | 3.9% |
| Maximum | 52.7% | 9.9% |
| Range | 50.6% | 6.0% |
| Mean | 13.3% | 6.0% |
| Median | 9.1% | 5.9% |
| Interquartile 25% (IQ1) | 6.8% | 5.5% |
| Interquartile 75% (IQ3) | 17.1% | 6.4% |
| Interquartile Range (IQR) | 10.3% | 0.96% |
| Standard Deviation (Sample) | 9.6% | 0.85% |
| Standard Deviation (Population) | 9.5% | 0.84% |
Similar Demographics by Disability Age 5 to 17
Demographics Similar to Scottish by Disability Age 5 to 17
In terms of disability age 5 to 17, the demographic groups most similar to Scottish are Portuguese (6.1%, a difference of 0.25%), German (6.1%, a difference of 0.25%), Immigrants from Jamaica (6.1%, a difference of 0.39%), Ugandan (6.2%, a difference of 0.41%), and Subsaharan African (6.2%, a difference of 0.44%).
| Demographics | Rating | Rank | Disability Age 5 to 17 |
| Cheyenne | 0.2 /100 | #274 | Tragic 6.0% |
| Dutch | 0.2 /100 | #275 | Tragic 6.0% |
| Japanese | 0.1 /100 | #276 | Tragic 6.1% |
| Puget Sound Salish | 0.1 /100 | #277 | Tragic 6.1% |
| Immigrants | Liberia | 0.1 /100 | #278 | Tragic 6.1% |
| Immigrants | Jamaica | 0.1 /100 | #279 | Tragic 6.1% |
| Portuguese | 0.1 /100 | #280 | Tragic 6.1% |
| Scottish | 0.0 /100 | #281 | Tragic 6.1% |
| Germans | 0.0 /100 | #282 | Tragic 6.1% |
| Ugandans | 0.0 /100 | #283 | Tragic 6.2% |
| Sub-Saharan Africans | 0.0 /100 | #284 | Tragic 6.2% |
| English | 0.0 /100 | #285 | Tragic 6.2% |
| Colville | 0.0 /100 | #286 | Tragic 6.2% |
| Pima | 0.0 /100 | #287 | Tragic 6.2% |
| Jamaicans | 0.0 /100 | #288 | Tragic 6.2% |
Demographics Similar to Hispanics or Latinos by Disability Age 5 to 17
In terms of disability age 5 to 17, the demographic groups most similar to Hispanics or Latinos are Brazilian (5.9%, a difference of 0.040%), Hopi (5.9%, a difference of 0.090%), Slavic (5.9%, a difference of 0.090%), Somali (5.9%, a difference of 0.22%), and Italian (5.9%, a difference of 0.28%).
| Demographics | Rating | Rank | Disability Age 5 to 17 |
| Poles | 1.5 /100 | #250 | Tragic 5.9% |
| Immigrants | Cambodia | 1.5 /100 | #251 | Tragic 5.9% |
| Hondurans | 1.5 /100 | #252 | Tragic 5.9% |
| Scandinavians | 1.4 /100 | #253 | Tragic 5.9% |
| Barbadians | 1.3 /100 | #254 | Tragic 5.9% |
| Italians | 1.2 /100 | #255 | Tragic 5.9% |
| Hopi | 1.0 /100 | #256 | Tragic 5.9% |
| Hispanics or Latinos | 1.0 /100 | #257 | Tragic 5.9% |
| Brazilians | 0.9 /100 | #258 | Tragic 5.9% |
| Slavs | 0.9 /100 | #259 | Tragic 5.9% |
| Somalis | 0.8 /100 | #260 | Tragic 5.9% |
| Immigrants | Middle Africa | 0.7 /100 | #261 | Tragic 5.9% |
| Immigrants | Western Africa | 0.7 /100 | #262 | Tragic 5.9% |
| Czechoslovakians | 0.7 /100 | #263 | Tragic 5.9% |
| Canadians | 0.6 /100 | #264 | Tragic 6.0% |