Romanian vs Immigrants from Laos Ambulatory Disability
COMPARE
Romanian
Immigrants from Laos
Ambulatory Disability
Ambulatory Disability Comparison
Romanians
Immigrants from Laos
6.0%
AMBULATORY DISABILITY
82.9/ 100
METRIC RATING
143rd/ 347
METRIC RANK
6.3%
AMBULATORY DISABILITY
13.2/ 100
METRIC RATING
210th/ 347
METRIC RANK
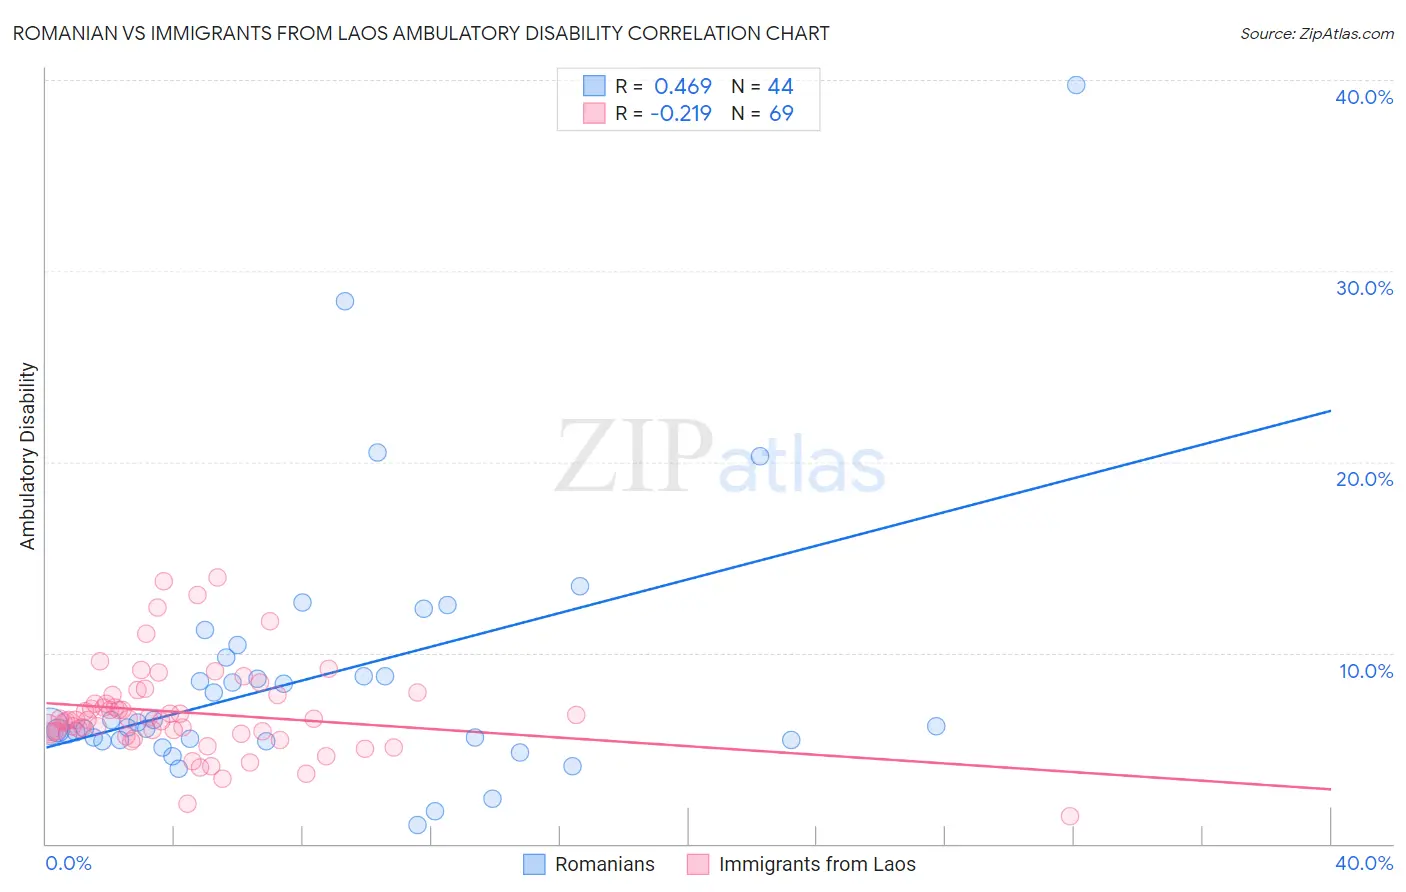
Romanian vs Immigrants from Laos Ambulatory Disability Correlation Chart
The statistical analysis conducted on geographies consisting of 377,793,215 people shows a moderate positive correlation between the proportion of Romanians and percentage of population with ambulatory disability in the United States with a correlation coefficient (R) of 0.469 and weighted average of 6.0%. Similarly, the statistical analysis conducted on geographies consisting of 201,465,206 people shows a weak negative correlation between the proportion of Immigrants from Laos and percentage of population with ambulatory disability in the United States with a correlation coefficient (R) of -0.219 and weighted average of 6.3%, a difference of 4.7%.
Ambulatory Disability Correlation Summary
| Measurement | Romanian | Immigrants from Laos |
| Minimum | 1.00% | 1.4% |
| Maximum | 39.7% | 13.9% |
| Range | 38.7% | 12.5% |
| Mean | 8.7% | 6.9% |
| Median | 6.2% | 6.5% |
| Interquartile 25% (IQ1) | 5.4% | 5.8% |
| Interquartile 75% (IQ3) | 9.3% | 7.8% |
| Interquartile Range (IQR) | 3.8% | 2.0% |
| Standard Deviation (Sample) | 7.0% | 2.4% |
| Standard Deviation (Population) | 6.9% | 2.4% |
Similar Demographics by Ambulatory Disability
Demographics Similar to Romanians by Ambulatory Disability
In terms of ambulatory disability, the demographic groups most similar to Romanians are Immigrants from Philippines (6.0%, a difference of 0.010%), Macedonian (6.0%, a difference of 0.010%), Swedish (6.0%, a difference of 0.020%), Czech (6.0%, a difference of 0.040%), and Pakistani (6.0%, a difference of 0.040%).
| Demographics | Rating | Rank | Ambulatory Disability |
| Immigrants | North Macedonia | 84.1 /100 | #136 | Excellent 6.0% |
| Immigrants | Syria | 84.1 /100 | #137 | Excellent 6.0% |
| Immigrants | Hungary | 83.9 /100 | #138 | Excellent 6.0% |
| Immigrants | Zaire | 83.6 /100 | #139 | Excellent 6.0% |
| Czechs | 83.3 /100 | #140 | Excellent 6.0% |
| Swedes | 83.1 /100 | #141 | Excellent 6.0% |
| Immigrants | Philippines | 83.0 /100 | #142 | Excellent 6.0% |
| Romanians | 82.9 /100 | #143 | Excellent 6.0% |
| Macedonians | 82.8 /100 | #144 | Excellent 6.0% |
| Pakistanis | 82.5 /100 | #145 | Excellent 6.0% |
| Immigrants | Greece | 82.5 /100 | #146 | Excellent 6.0% |
| Immigrants | Moldova | 82.4 /100 | #147 | Excellent 6.0% |
| Immigrants | Eastern Europe | 82.0 /100 | #148 | Excellent 6.0% |
| Lithuanians | 81.9 /100 | #149 | Excellent 6.0% |
| Maltese | 81.6 /100 | #150 | Excellent 6.0% |
Demographics Similar to Immigrants from Laos by Ambulatory Disability
In terms of ambulatory disability, the demographic groups most similar to Immigrants from Laos are Immigrants from Iraq (6.3%, a difference of 0.080%), Bangladeshi (6.3%, a difference of 0.10%), Samoan (6.3%, a difference of 0.14%), Mexican American Indian (6.3%, a difference of 0.15%), and Japanese (6.3%, a difference of 0.15%).
| Demographics | Rating | Rank | Ambulatory Disability |
| Immigrants | Ukraine | 18.4 /100 | #203 | Poor 6.2% |
| Immigrants | Congo | 18.2 /100 | #204 | Poor 6.2% |
| Slovenes | 18.0 /100 | #205 | Poor 6.2% |
| Finns | 17.2 /100 | #206 | Poor 6.2% |
| Alsatians | 15.1 /100 | #207 | Poor 6.3% |
| Bangladeshis | 14.2 /100 | #208 | Poor 6.3% |
| Immigrants | Iraq | 14.0 /100 | #209 | Poor 6.3% |
| Immigrants | Laos | 13.2 /100 | #210 | Poor 6.3% |
| Samoans | 12.1 /100 | #211 | Poor 6.3% |
| Mexican American Indians | 12.0 /100 | #212 | Poor 6.3% |
| Japanese | 12.0 /100 | #213 | Poor 6.3% |
| Immigrants | Mexico | 11.0 /100 | #214 | Poor 6.3% |
| Immigrants | Latin America | 11.0 /100 | #215 | Poor 6.3% |
| Canadians | 10.9 /100 | #216 | Poor 6.3% |
| Yugoslavians | 10.9 /100 | #217 | Poor 6.3% |