Romanian vs Immigrants from Laos 7th Grade
COMPARE
Romanian
Immigrants from Laos
7th Grade
7th Grade Comparison
Romanians
Immigrants from Laos
96.7%
7TH GRADE
99.1/ 100
METRIC RATING
84th/ 347
METRIC RANK
94.5%
7TH GRADE
0.0/ 100
METRIC RATING
302nd/ 347
METRIC RANK
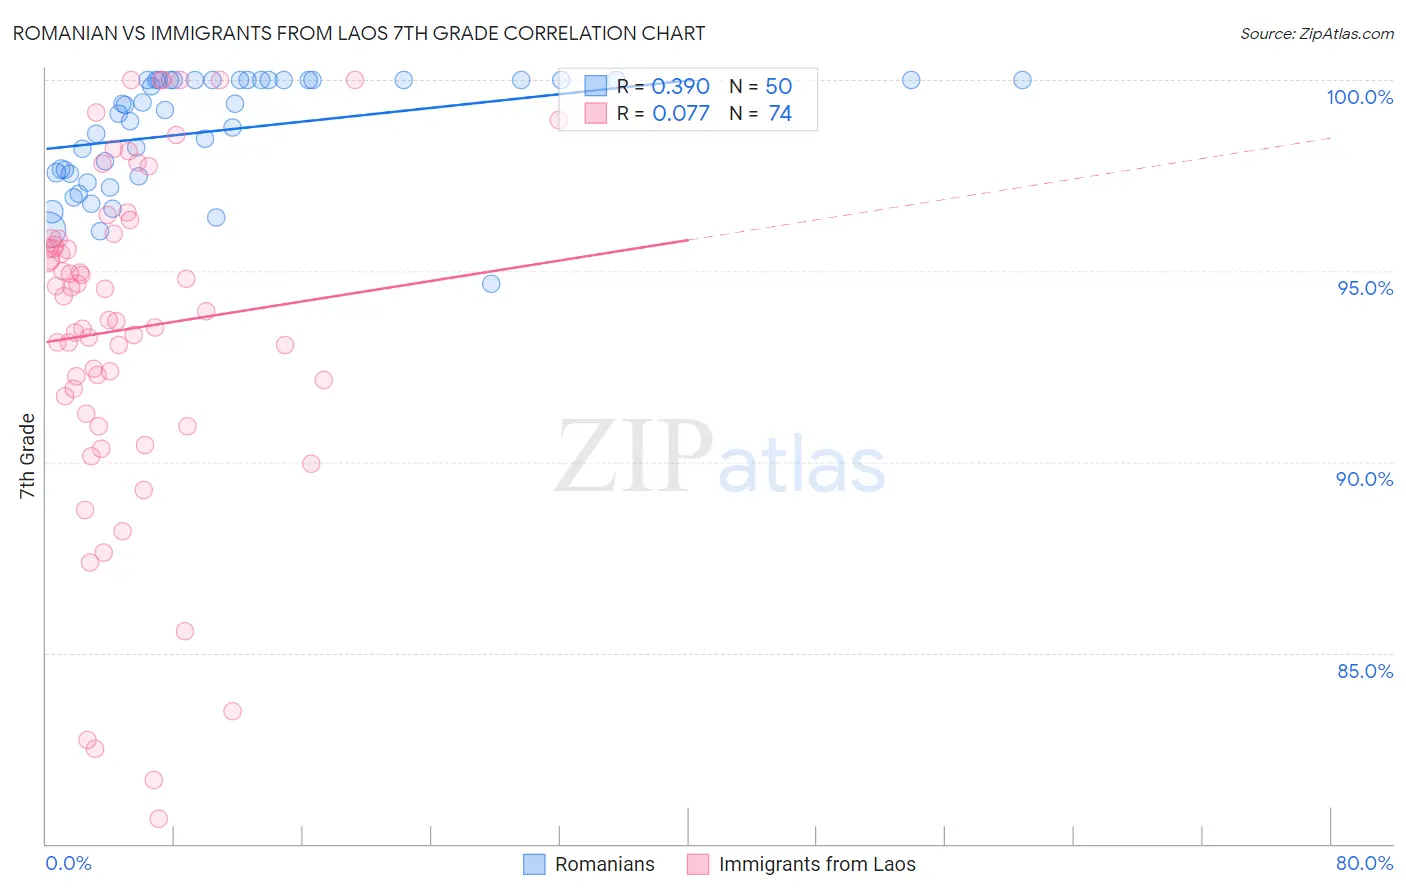
Romanian vs Immigrants from Laos 7th Grade Correlation Chart
The statistical analysis conducted on geographies consisting of 377,904,438 people shows a mild positive correlation between the proportion of Romanians and percentage of population with at least 7th grade education in the United States with a correlation coefficient (R) of 0.390 and weighted average of 96.7%. Similarly, the statistical analysis conducted on geographies consisting of 201,472,886 people shows a slight positive correlation between the proportion of Immigrants from Laos and percentage of population with at least 7th grade education in the United States with a correlation coefficient (R) of 0.077 and weighted average of 94.5%, a difference of 2.4%.
7th Grade Correlation Summary
| Measurement | Romanian | Immigrants from Laos |
| Minimum | 94.7% | 80.6% |
| Maximum | 100.0% | 100.0% |
| Range | 5.3% | 19.4% |
| Mean | 98.7% | 93.5% |
| Median | 99.3% | 94.1% |
| Interquartile 25% (IQ1) | 97.5% | 91.7% |
| Interquartile 75% (IQ3) | 100.0% | 95.8% |
| Interquartile Range (IQR) | 2.5% | 4.1% |
| Standard Deviation (Sample) | 1.5% | 4.5% |
| Standard Deviation (Population) | 1.4% | 4.4% |
Similar Demographics by 7th Grade
Demographics Similar to Romanians by 7th Grade
In terms of 7th grade, the demographic groups most similar to Romanians are Icelander (96.7%, a difference of 0.0%), Kiowa (96.7%, a difference of 0.0%), Chickasaw (96.7%, a difference of 0.010%), Turkish (96.7%, a difference of 0.010%), and Delaware (96.8%, a difference of 0.020%).
| Demographics | Rating | Rank | 7th Grade |
| Cherokee | 99.4 /100 | #77 | Exceptional 96.8% |
| Immigrants | Netherlands | 99.3 /100 | #78 | Exceptional 96.8% |
| Cypriots | 99.3 /100 | #79 | Exceptional 96.8% |
| Yugoslavians | 99.3 /100 | #80 | Exceptional 96.8% |
| Delaware | 99.2 /100 | #81 | Exceptional 96.8% |
| Chickasaw | 99.2 /100 | #82 | Exceptional 96.7% |
| Icelanders | 99.1 /100 | #83 | Exceptional 96.7% |
| Romanians | 99.1 /100 | #84 | Exceptional 96.7% |
| Kiowa | 99.1 /100 | #85 | Exceptional 96.7% |
| Turks | 99.1 /100 | #86 | Exceptional 96.7% |
| Immigrants | Belgium | 99.0 /100 | #87 | Exceptional 96.7% |
| Puget Sound Salish | 99.0 /100 | #88 | Exceptional 96.7% |
| Cree | 99.0 /100 | #89 | Exceptional 96.7% |
| Immigrants | South Africa | 98.9 /100 | #90 | Exceptional 96.7% |
| Osage | 98.9 /100 | #91 | Exceptional 96.7% |
Demographics Similar to Immigrants from Laos by 7th Grade
In terms of 7th grade, the demographic groups most similar to Immigrants from Laos are Immigrants from Dominica (94.5%, a difference of 0.0%), Immigrants from Burma/Myanmar (94.5%, a difference of 0.030%), Indonesian (94.5%, a difference of 0.070%), Bangladeshi (94.5%, a difference of 0.070%), and Immigrants from South Eastern Asia (94.5%, a difference of 0.080%).
| Demographics | Rating | Rank | 7th Grade |
| Yaqui | 0.0 /100 | #295 | Tragic 94.6% |
| Cubans | 0.0 /100 | #296 | Tragic 94.6% |
| Immigrants | South Eastern Asia | 0.0 /100 | #297 | Tragic 94.5% |
| Indonesians | 0.0 /100 | #298 | Tragic 94.5% |
| Bangladeshis | 0.0 /100 | #299 | Tragic 94.5% |
| Immigrants | Burma/Myanmar | 0.0 /100 | #300 | Tragic 94.5% |
| Immigrants | Dominica | 0.0 /100 | #301 | Tragic 94.5% |
| Immigrants | Laos | 0.0 /100 | #302 | Tragic 94.5% |
| Sri Lankans | 0.0 /100 | #303 | Tragic 94.4% |
| Immigrants | Haiti | 0.0 /100 | #304 | Tragic 94.3% |
| Guyanese | 0.0 /100 | #305 | Tragic 94.3% |
| Immigrants | Guyana | 0.0 /100 | #306 | Tragic 94.2% |
| Immigrants | Portugal | 0.0 /100 | #307 | Tragic 94.2% |
| Cape Verdeans | 0.0 /100 | #308 | Tragic 94.1% |
| Ecuadorians | 0.0 /100 | #309 | Tragic 94.0% |