Alaska Native vs Immigrants from Laos Ambulatory Disability
COMPARE
Alaska Native
Immigrants from Laos
Ambulatory Disability
Ambulatory Disability Comparison
Alaska Natives
Immigrants from Laos
6.2%
AMBULATORY DISABILITY
29.8/ 100
METRIC RATING
194th/ 347
METRIC RANK
6.3%
AMBULATORY DISABILITY
13.2/ 100
METRIC RATING
210th/ 347
METRIC RANK
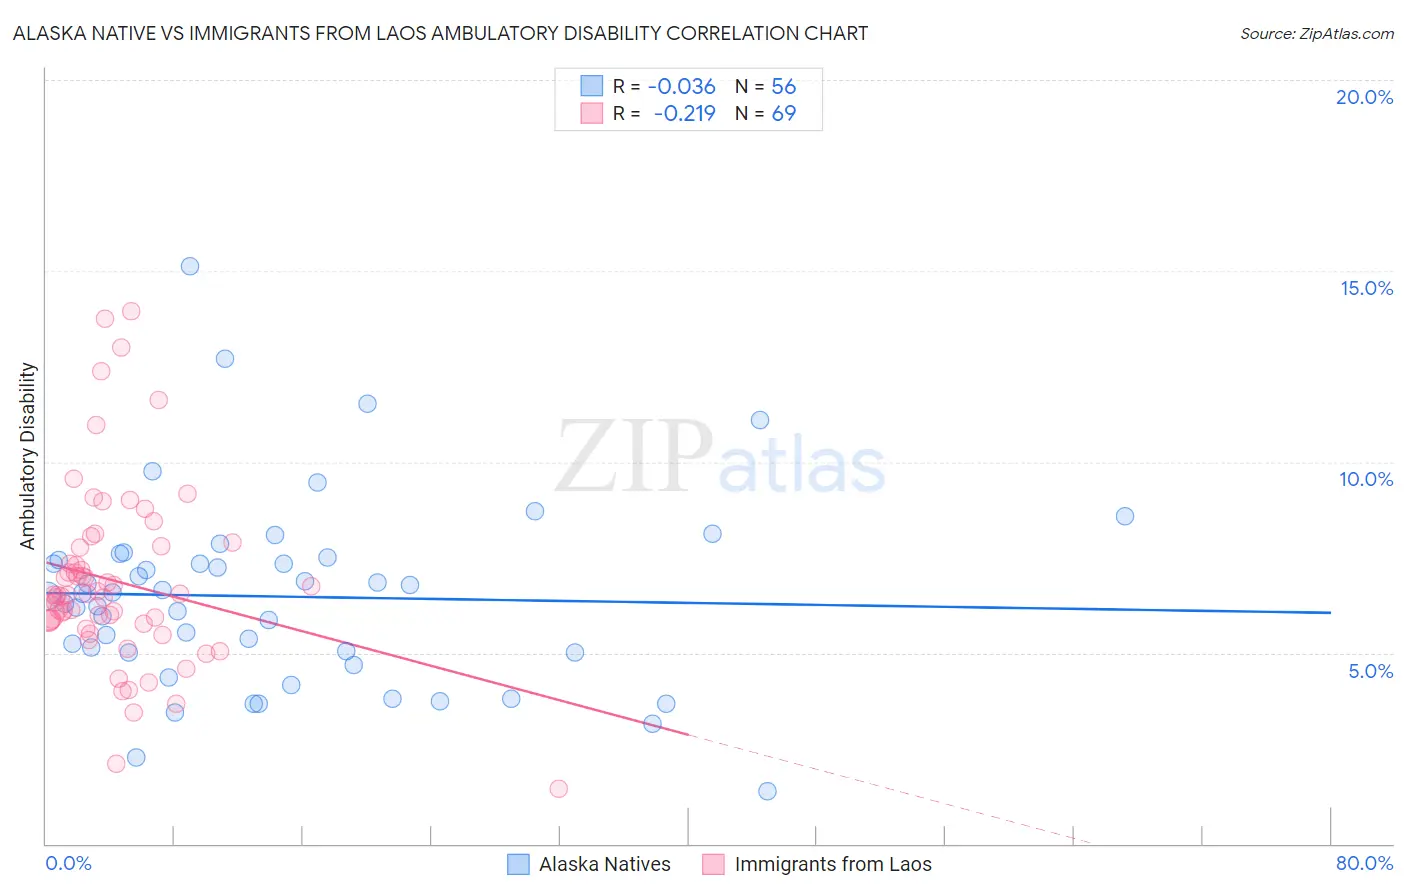
Alaska Native vs Immigrants from Laos Ambulatory Disability Correlation Chart
The statistical analysis conducted on geographies consisting of 76,753,099 people shows no correlation between the proportion of Alaska Natives and percentage of population with ambulatory disability in the United States with a correlation coefficient (R) of -0.036 and weighted average of 6.2%. Similarly, the statistical analysis conducted on geographies consisting of 201,465,206 people shows a weak negative correlation between the proportion of Immigrants from Laos and percentage of population with ambulatory disability in the United States with a correlation coefficient (R) of -0.219 and weighted average of 6.3%, a difference of 1.3%.
Ambulatory Disability Correlation Summary
| Measurement | Alaska Native | Immigrants from Laos |
| Minimum | 1.4% | 1.4% |
| Maximum | 15.1% | 13.9% |
| Range | 13.8% | 12.5% |
| Mean | 6.5% | 6.9% |
| Median | 6.5% | 6.5% |
| Interquartile 25% (IQ1) | 5.0% | 5.8% |
| Interquartile 75% (IQ3) | 7.5% | 7.8% |
| Interquartile Range (IQR) | 2.5% | 2.0% |
| Standard Deviation (Sample) | 2.5% | 2.4% |
| Standard Deviation (Population) | 2.5% | 2.4% |
Demographics Similar to Alaska Natives and Immigrants from Laos by Ambulatory Disability
In terms of ambulatory disability, the demographic groups most similar to Alaska Natives are Guatemalan (6.2%, a difference of 0.010%), Belgian (6.2%, a difference of 0.080%), Malaysian (6.2%, a difference of 0.10%), Immigrants from Western Europe (6.2%, a difference of 0.11%), and Polish (6.2%, a difference of 0.23%). Similarly, the demographic groups most similar to Immigrants from Laos are Immigrants from Iraq (6.3%, a difference of 0.080%), Bangladeshi (6.3%, a difference of 0.10%), Samoan (6.3%, a difference of 0.14%), Mexican American Indian (6.3%, a difference of 0.15%), and Alsatian (6.3%, a difference of 0.19%).
| Demographics | Rating | Rank | Ambulatory Disability |
| Immigrants | Western Europe | 31.6 /100 | #192 | Fair 6.2% |
| Guatemalans | 30.0 /100 | #193 | Fair 6.2% |
| Alaska Natives | 29.8 /100 | #194 | Fair 6.2% |
| Belgians | 28.6 /100 | #195 | Fair 6.2% |
| Malaysians | 28.2 /100 | #196 | Fair 6.2% |
| Poles | 26.3 /100 | #197 | Fair 6.2% |
| Immigrants | Bangladesh | 24.6 /100 | #198 | Fair 6.2% |
| Italians | 22.6 /100 | #199 | Fair 6.2% |
| Immigrants | Cambodia | 21.5 /100 | #200 | Fair 6.2% |
| Immigrants | Central America | 20.1 /100 | #201 | Fair 6.2% |
| Albanians | 19.7 /100 | #202 | Poor 6.2% |
| Immigrants | Ukraine | 18.4 /100 | #203 | Poor 6.2% |
| Immigrants | Congo | 18.2 /100 | #204 | Poor 6.2% |
| Slovenes | 18.0 /100 | #205 | Poor 6.2% |
| Finns | 17.2 /100 | #206 | Poor 6.2% |
| Alsatians | 15.1 /100 | #207 | Poor 6.3% |
| Bangladeshis | 14.2 /100 | #208 | Poor 6.3% |
| Immigrants | Iraq | 14.0 /100 | #209 | Poor 6.3% |
| Immigrants | Laos | 13.2 /100 | #210 | Poor 6.3% |
| Samoans | 12.1 /100 | #211 | Poor 6.3% |
| Mexican American Indians | 12.0 /100 | #212 | Poor 6.3% |